

Question: How do I show a dotted line on this excel graph where the blue line meets the green line and where the blue line meets
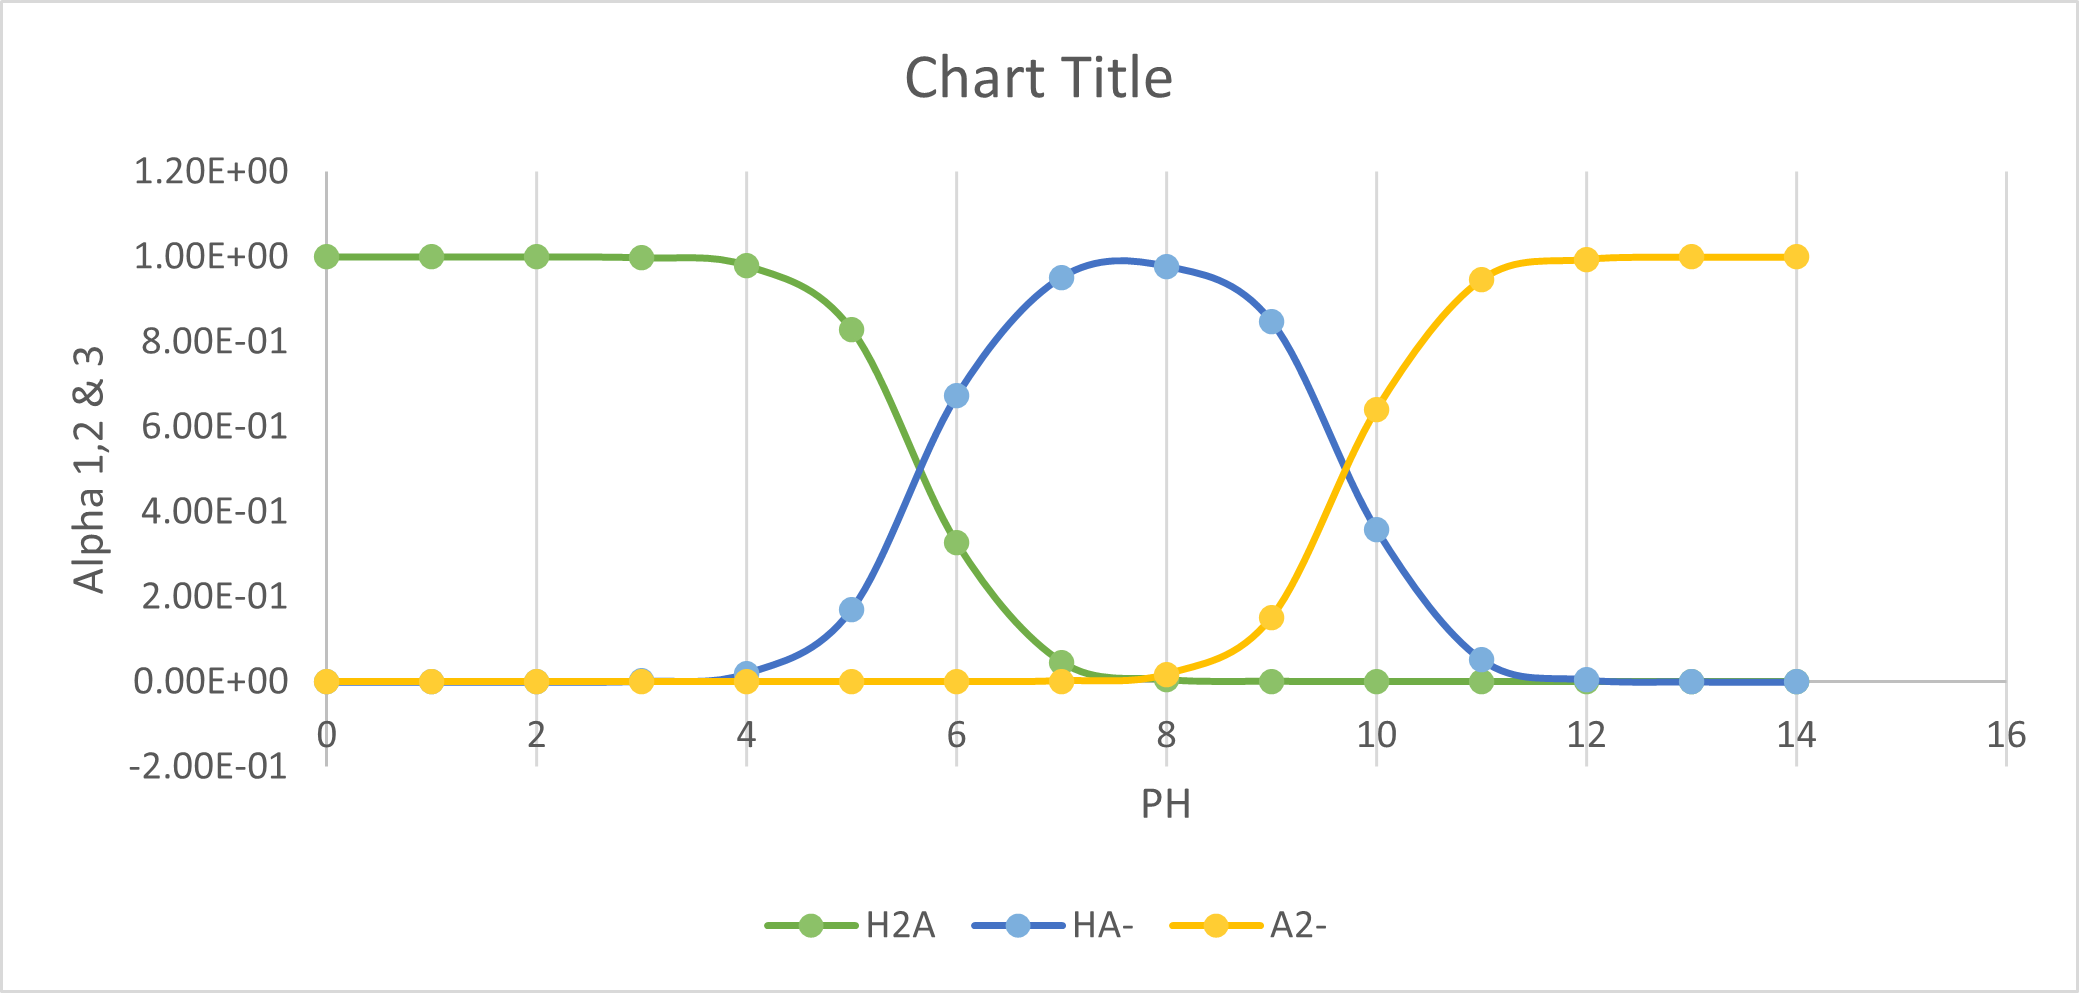 How do I show a dotted line on this excel graph where the blue line meets the green line and where the blue line meets the yellow line so that I can calculate the pH values and the alpha values on the Y axis?
Chart Title
Step by Step Solution
There are 3 Steps involved in it
1 Expert Approved Answer
Step: 1 Unlock

Question Has Been Solved by an Expert!
Get step-by-step solutions from verified subject matter experts
Step: 2 Unlock
Step: 3 Unlock