

Question: How do I solve for the Excel problems highlighted in blue? Exhibit 1 ROSETTA STONE, INC.: PRICING THE 2009 IPO Rosetta Stone Income Statement (in
How do I solve for the Excel problems highlighted in blue?
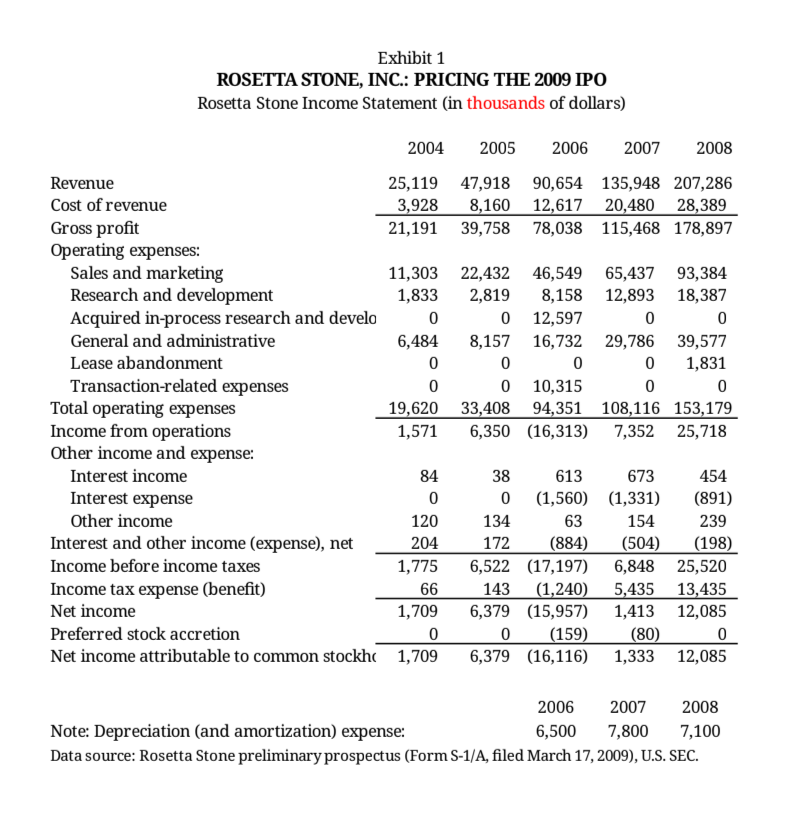
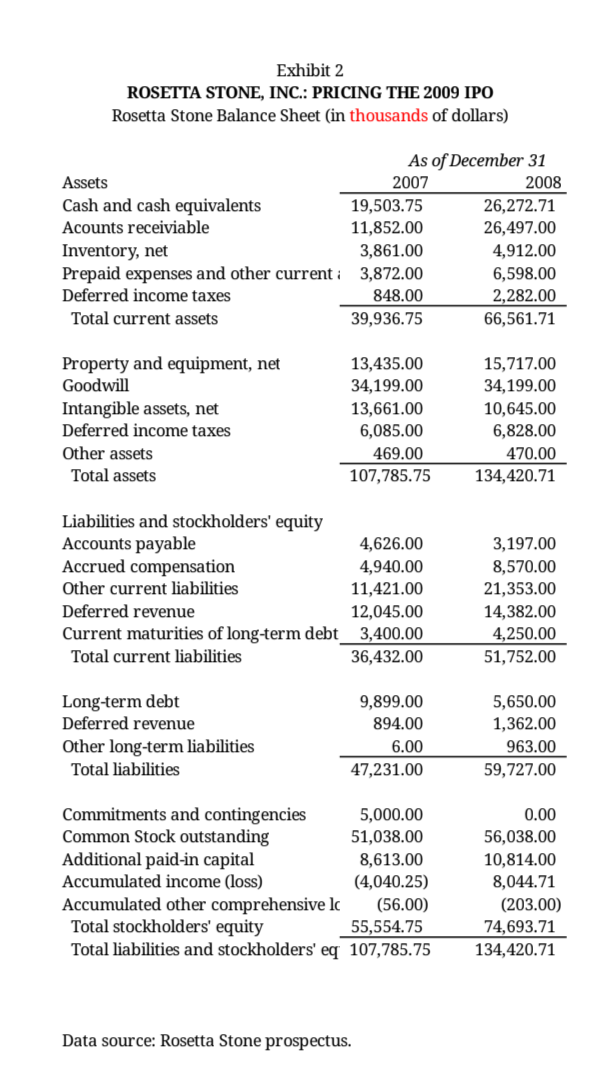
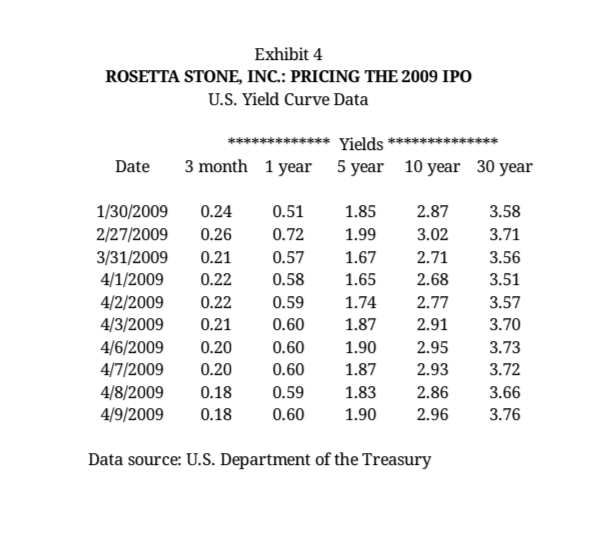
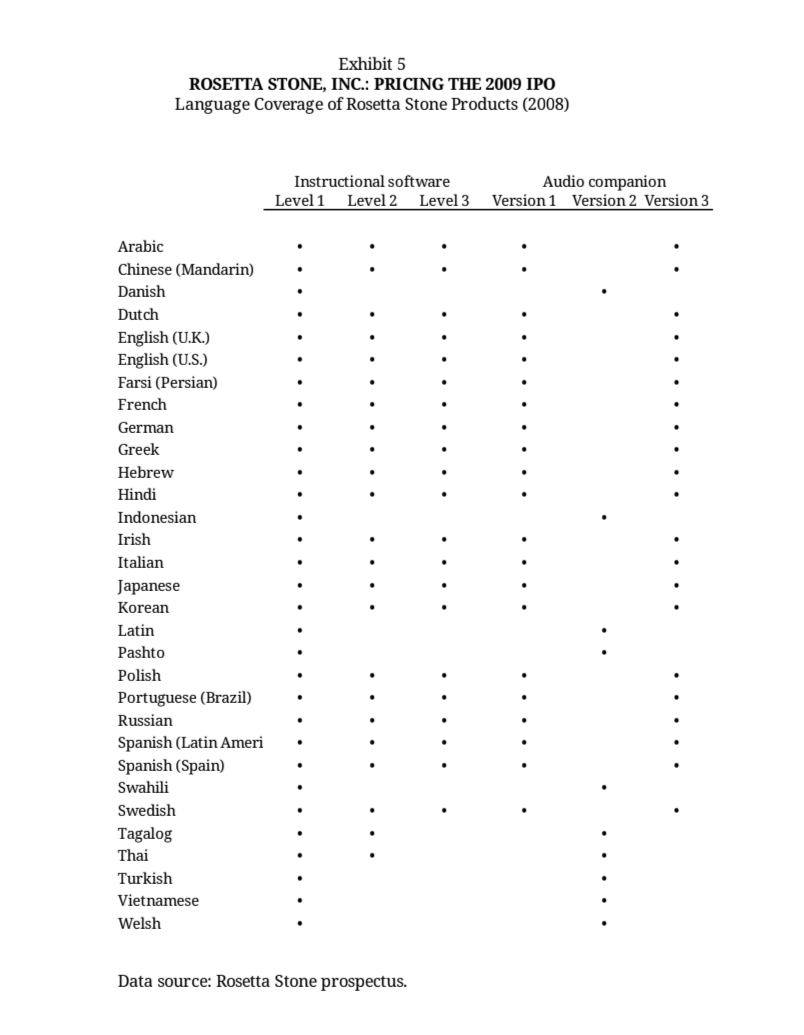
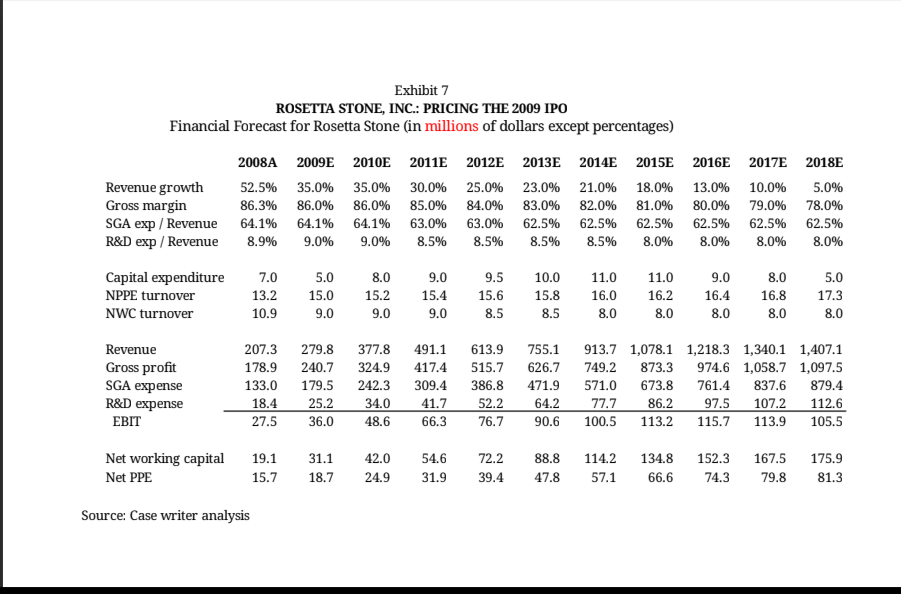
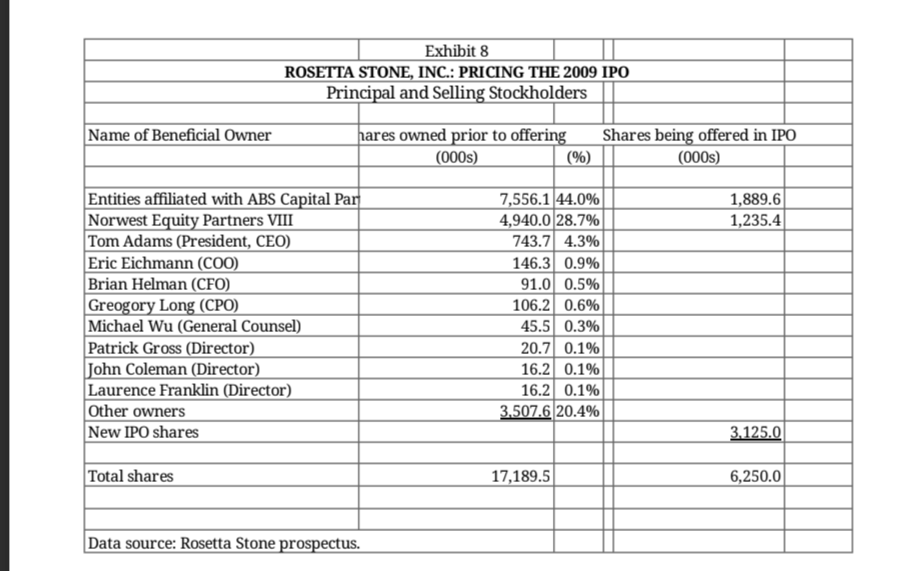
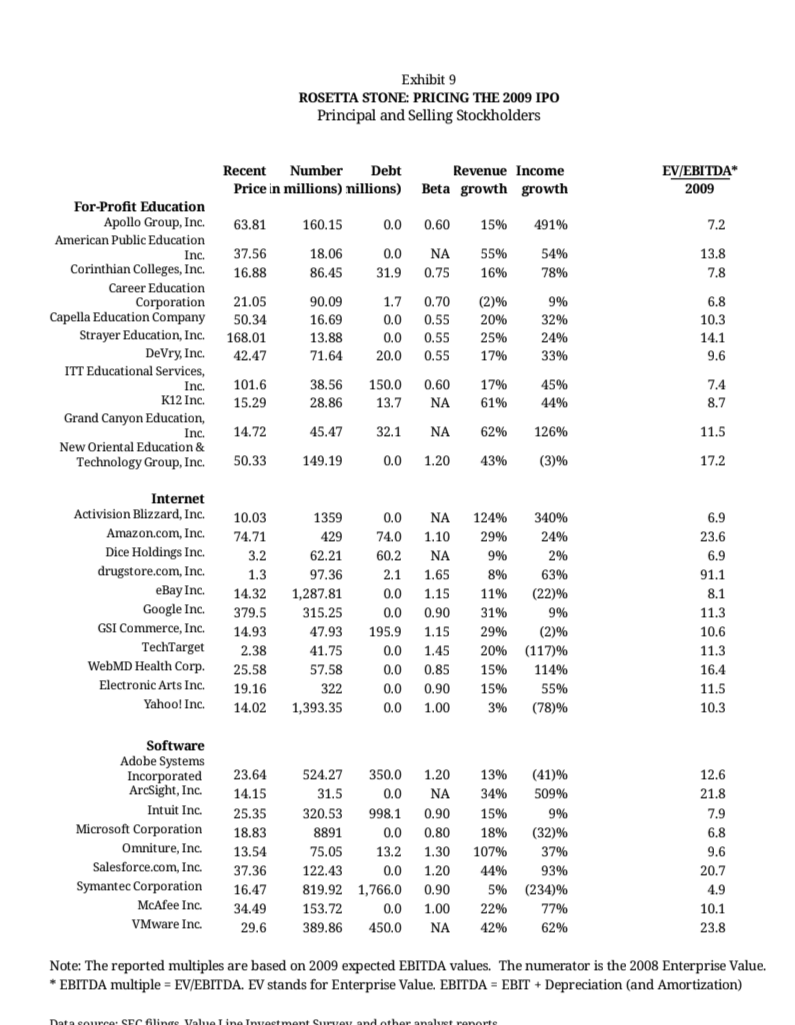
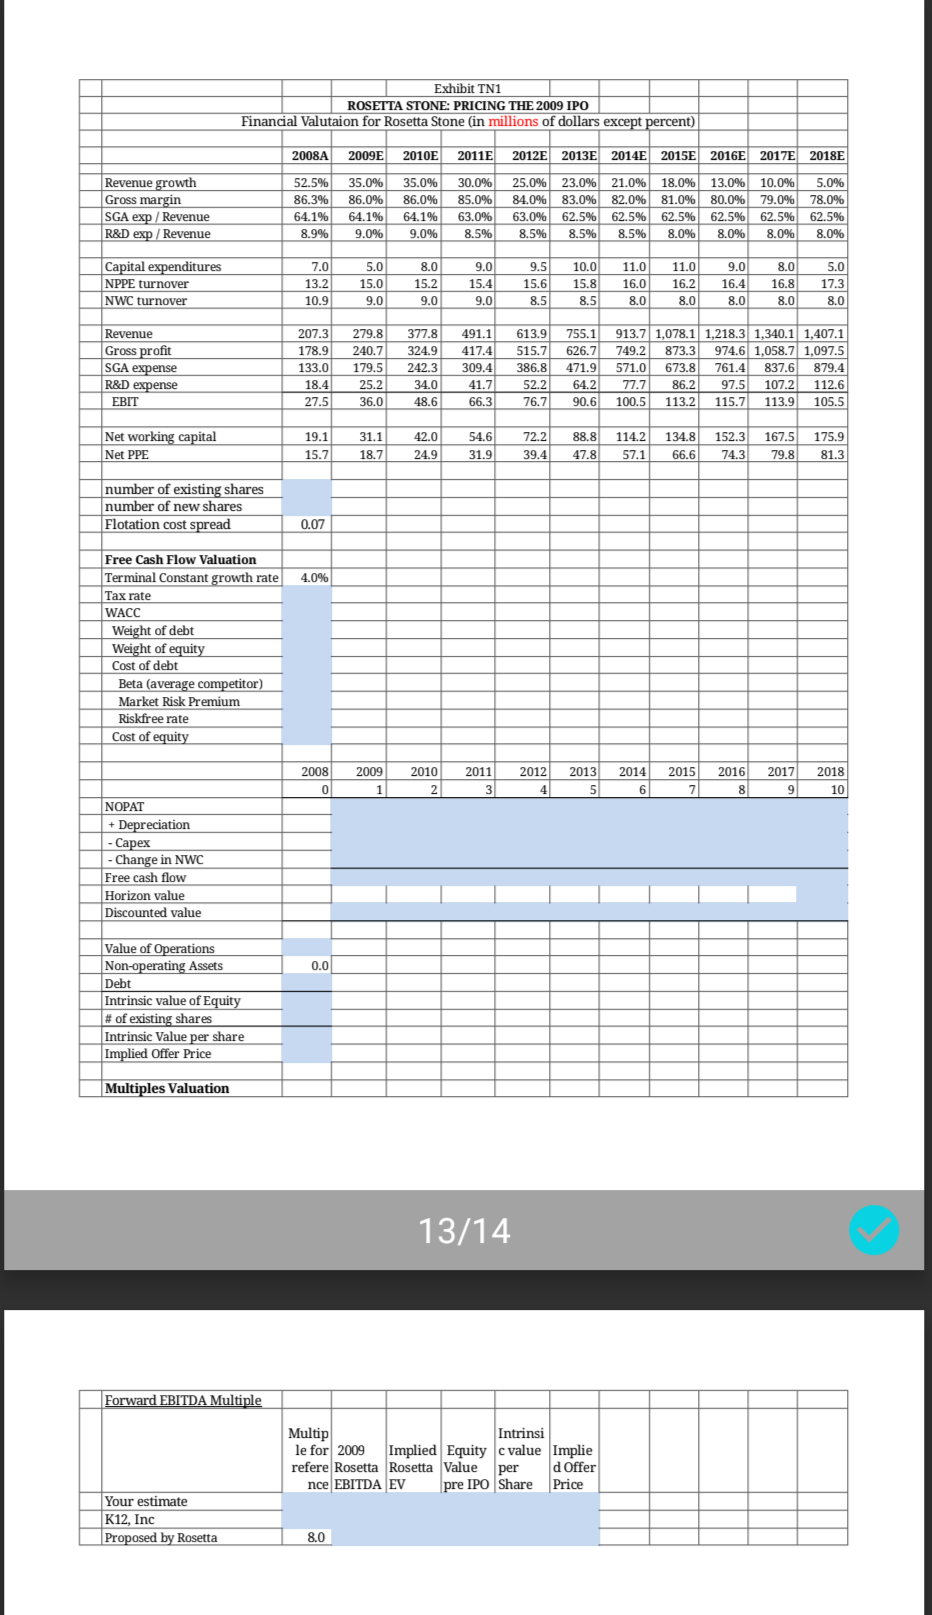
Exhibit 1 ROSETTA STONE, INC.: PRICING THE 2009 IPO Rosetta Stone Income Statement (in thousands of dollars) 2004 2005 2006 2007 2008 Revenue 25,119 47,918 90,654 135,948 207,286 Cost of revenue 3,928 8,160 12,617 20,480 28,389 Gross profit 21,191 39,758 78,038 115,468 178,897 Operating expenses: Sales and marketing 11,303 22,432 46,549 65,437 93,384 Research and development 1,833 2,819 8,158 12,893 18,387 Acquired in-process research and develo 0 0 12,597 0 0 General and administrative 6,484 8,157 16,732 29,786 39,577 Lease abandonment 0 O 0 0 1,831 Transaction-related expenses 0 0 10,315 0 0 Total operating expenses 19,620 33,408 94,351 108,116 153,179 Income from operations 1,571 6,350 (16,313) 7,352 25,718 Other income and expense: Interest income 84 38 613 673 454 Interest expense 0 0 (1,560) (1,331) (891) Other income 120 134 63 154 239 Interest and other income (expense), net 204 172 (884) (504) (198) Income before income taxes 1,775 6,522 (17,197) 6,848 25,520 Income tax expense (benefit) 66 143 (1,240) 5,435 13,435 Net income 1,709 6,379 (15,957) 1,413 12,085 Preferred stock accretion 0 0 (159) (80) 0 Net income attributable to common stockh( 1,709 6,379 (16,116) 1,333 12,085 2006 2007 2008 Note: Depreciation (and amortization) expense: 6,500 7,800 7,100 Data source: Rosetta Stone preliminary prospectus (Form S-1/A, filed March 17, 2009), U.S. SEC.Exhibit 2 ROSETTA STONE, INC.: PRICING THE 2009 IPO Rosetta Stone Balance Sheet (in thousands of dollars) As of December 31 Assets 2007 2008 Cash and cash equivalents 19,503.75 26,272.71 Acounts receiviable 11,852.00 26,497.00 Inventory, net 3,861.00 4,912.00 Prepaid expenses and other current : 3,872.00 6,598.00 Deferred income taxes 848.00 2,282.00 Total current assets 39,936.75 66,561.71 Property and equipment, net 13,435.00 15,717.00 Goodwill 34,199.00 34,199.00 Intangible assets, net 13,661.00 10,645.00 Deferred income taxes 6,085.00 6,828.00 Other assets 469.00 470.00 Total assets 107,785.75 134,420.71 Liabilities and stockholders' equity Accounts payable 4,626.00 3,197.00 Accrued compensation 4,940.00 8,570.00 Other current liabilities 11,421.00 21,353.00 Deferred revenue 12,045.00 14,382.00 Current maturities of long-term debt 3,400.00 4,250.00 Total current liabilities 36,432.00 51,752.00 Long-term debt 9,899.00 5,650.00 Deferred revenue 894.00 1,362.00 Other long-term liabilities 6.00 963.00 Total liabilities 47,231.00 59,727.00 Commitments and contingencies 5,000.00 0.00 Common Stock outstanding 51,038.00 56,038.00 Additional paid-in capital 8,613.00 10,814.00 Accumulated income (loss) (4,040.25) 8,044.71 Accumulated other comprehensive Ic (56.00) (203.00) Total stockholders' equity 55,554.75 74,693.71 Total liabilities and stockholders' eq 107,785.75 134,420.71 Data source: Rosetta Stone prospectus.Exhibit 4 ROSETTA STONE, INC.: PRICING THE 2009 IPO U.S. Yield Curve Data Date 3 month 1 year 5 year 10 year 30 year 1/30/2009 0.24 0.51 1.85 2.87 3.58 2/27/2009 0.26 0.72 1.99 3.02 3.71 3/31/2009 0.21 0.57 1.67 2.71 3.56 4/1/2009 0.22 0.58 1.65 2.68 3.51 4/2/2009 0.22 0.59 1.74 2.77 3.57 4/3/2009 0.21 0.60 1.87 2.91 3.70 4/6/2009 0.20 0.60 1.90 2.95 3.73 4/7/2009 0.20 0.60 1.87 2.93 3.72 4/8/2009 0.18 0.59 1.83 2.86 3.66 4/9/2009 0.18 0.60 1.90 2.96 3.76 Data source: U.S. Department of the TreasuryExhibit 5 ROSETTA STONE, INC.: PRICING THE 2009 IPO Language Coverage of Rosetta Stone Products (2008) Instructional software Audio companion Level 1 Level 2 Level 3 Version 1 Version 2 Version 3 Arabic Chinese (Mandarin) . Danish . Dutch English (U.K.) English (U.S.) Farsi (Persian) French German Greek Hebrew . Hindi Indonesian Irish Italian . . . . . Japanese Korean Latin Pashto Polish Portuguese (Brazil) . . . . . . . . Russian Spanish (Latin Ameri . Spanish (Spain) Swahili Swedish Tagalog . Thai . . . . Turkish Vietnamese Welsh Data source: Rosetta Stone prospectus.Exhibit 7 ROSETTA STONE, INC.: PRICING THE 2009 IPO Financial Forecast for Rosetta Stone (in millions of dollars except percentages) 2008A 2009E 20101 2011E 2012E 2013E 20141 2015E 2016E 2017E 2018E Revenue growth 52.5% 35.0% 35.0% 30.0% 25.0% 23.0% 21.0% 18.0% 13.0% 10.0% 5.0% Gross margin 86.3% 86.0% 86.0% 85.0% 84.0% 83.0% 82.0% 81.0% 80.0% 79.0% 78.0% SGA exp / Revenue 64.1% 64.1% 64.1% 63.0% 63.0% 62.5% 62.5% 62.5% 62.5% 62.5% 62.5% R&D exp / Revenue 8.9% 9.0% 9.0% 8.5% 8.5% 8.5% 8.5% 8.0% 8.0% 8.0% 8.0% Capital expenditure 7.0 5.0 8.0 9.0 9.5 10.0 11.0 11.0 9.0 8.0 5.0 NPPE turnover 13.2 15.0 15.2 15.4 15.6 15.8 16.0 16.2 16.4 16.8 17.3 NWC turnover 10.9 9.0 9.0 9.0 8.5 8.5 8.0 8.0 8.0 8.0 8.0 Revenue 207.3 279.8 377.8 491.1 613.9 755.1 913.7 1,078.1 1,218.3 1,340.1 1,407.1 Gross profit 178.9 240.7 324.9 417.4 515.7 626.7 749.2 873.3 974.6 1,058.7 1,097.5 SGA expense 133.0 179.5 242.3 309.4 386.8 471.9 571.0 673.8 761.4 837.6 879.4 R&D expense 18.4 25.2 34.0 41.7 52.2 64.2 77.7 86.2 97.5 107.2 112.6 EBIT 27.5 36.0 48.6 66.3 76.7 90.6 100.5 113.2 115.7 113.9 105.5 Net working capital 19.1 31.1 42.0 54.6 72.2 88.8 114.2 134.8 152.3 167.5 175.9 Net PPE 15.7 18.7 24.9 31.9 39.4 47.8 57.1 66.6 74.3 79.8 81.3 Source: Case writer analysisExhibit 8 ROSETTA STONE, INC.: PRICING THE 2009 IPO Principal and Selling Stockholders Name of Beneficial Owner hares owned prior to offering Shares being offered in IPO (000s) (%) (000s) Entities affiliated with ABS Capital Par 7,556.1 44.0% 1,889.6 Norwest Equity Partners VIII 4,940.0 28.7% 1,235.4 Tom Adams (President, CEO) 743.7 4.3% Eric Eichmann (COO) 146.3 0.9% Brian Helman (CFO) 91.0 0.5% Gregory Long (CPO) 106.2 0.6% Michael Wu (General Counsel) 45.5 0.3% Patrick Gross (Director) 20.7 0.1% John Coleman (Director) 16.2 0.1% Laurence Franklin (Director) 16.2 0.1% Other owners 3.507.6 20.4% New IPO shares 3.125.0 Total shares 17,189.5 6,250.0 Data source: Rosetta Stone prospectus.Exhibit 9 ROSETTA STONE: PRICING THE 2009 IPO Principal and Selling Stockholders Recent Number Debt Revenue Income EV/EBITDA* Price in millions) millions) Beta growth growth 2009 For-Profit Education Apollo Group, Inc. 63.81 160.15 0.0 0.60 15% 491% 7.2 American Public Education Inc. 37.56 18.06 0.0 NA 55% 54% 13.8 Corinthian Colleges, Inc. 16.88 86.45 31.9 0.75 16% 78% 7.8 Career Education Corporation 21.05 90.09 1.7 0.70 2)% 9% 6.8 Capella Education Company 50.34 16.69 3.0 0.55 20% 32% 10.3 Strayer Education, Inc. 168.01 13.88 0.0 0.55 25% 24% 14.1 DeVry, Inc. 42.47 71.64 20.0 0.55 17% 33% 9.6 ITT Educational Services, Inc. 101.6 38.56 150.0 0.60 17% 45% 7.4 K12 Inc. 15.29 28.86 13.7 NA 61% 44% 8.7 Grand Canyon Education, Inc. 14.72 45.47 32.1 NA 62% 126% 11.5 New Oriental Education & Technology Group, Inc. 50.33 149.19 0.0 1.20 43% (3)% 17.2 Internet Activision Blizzard, Inc. 10.03 1359 0.0 NA 124% 340% 6.9 Amazon.com, Inc. 74.71 429 74.0 1.10 29% 24% 23.6 Dice Holdings Inc. 3.2 62.21 60.2 NA 9% 2% 6.9 drugstore.com, Inc. 1.3 97.36 2.1 1.65 8% 63% 91.1 eBay Inc. 14.32 1,287.81 0.0 1.15 11% (22)% 8.1 Google Inc. 379.5 315.25 0.0 0.90 31% 9% 11.3 GSI Commerce, Inc. 14.93 47.93 195.9 1.15 29% (2)% 10.6 TechTarget 2.38 41.75 0.0 1.45 20% (117)% 11.3 WebMD Health Corp. 25.58 57.58 0.0 0.85 15% 114% 16.4 Electronic Arts Inc. 19.16 322 0.0 0.90 15% 55% 11.5 Yahoo! Inc. 14.02 1,393.35 0.0 1.00 3% (78)% 10.3 Software Adobe Systems Incorporated 23.64 524.27 350.0 1.20 13% (41)% 12.6 ArcSight, Inc. 14.15 31.5 0.0 NA 34% 509% 21.8 Intuit Inc. 25.35 320.53 998.1 0.90 15% 9% 7.9 Microsoft Corporation 18.83 8891 0.0 0.80 18% (32)% 6.8 Omniture, Inc. 13.54 75.05 13.2 1.30 107% 37% 9.6 Salesforce.com, Inc. 37.36 122.43 0.0 1.20 44% 93% 20. Symantec Corporation 16.47 819.92 1,766.0 0.90 5% (234)% 4.9 Mcafee Inc. 34.49 153.72 0.0 1.00 22% 77% 10.1 VMware Inc. 29.6 389.86 450.0 NA 42% 62% 23.8 Note: The reported multiples are based on 2009 expected EBITDA values. The numerator is the 2008 Enterprise Value. * EBITDA multiple = EV/EBITDA. EV stands for Enterprise Value. EBITDA = EBIT + Depreciation (and Amortization)Exhibit TN1 ROSETTA STONE: PRICING THE 2009 IPO Financial Valutaion for Rosetta Stone (in millions of dollars except percent) 2008A 2009E 2010E 2011E 2012E 2013E 2014E 2015E 2016E 2017E 2018E Revenue growth 52.5% 35.0% 35.0% 30.0% 25.0% 23.0% 21.0% 18.0% 13.0% 10.0% 5.09 Gross margin 86.3% 86.0% 86.0% 85.0% 84.0% 83.0% 82.0% 81.0% 80.0% 79.0% 78.0% SGA exp / Revenue 64.1% 64.1% 64.1% 63.0% 63.0% 62.5% 62.5% 62.5% 62.5% 62.5% 62.5% R&D exp / Revenue 8.9% 9.0% 9.0% 8.5% 8.5% 8.5% 8.5% 8.0% 8.0% 8.0% 8.0% Capital expenditures 7.0 5.0 8.0 9.0 9.5 10.0 11.0 11.0 9.0 8.0 5.0 NPPE turnover 13.2 15.0 15.2 15.4 15.6 15.8 16.0 16.2 16.4 16.8 17.3 NWC turnover 10.9 9.0 9.0 9.0 8.5 8.5 8.0 8.0 8.0 8.0 8.0 Revenue 207.3 279.8 377.8 491.1 613.9 755.1 913.7 1,078.1 1,218.3 1,340.1 1,407.1 Gross profit 178.9 240.7 324.9 417.4 515.7 626.7 749.2 873.3 974.6 1,058.7 1,097.5 SGA expense 133.0 179.5 242.3 309.4 386.8 471.9 571.0 673.8 761.4 837.6 879.4 R&D expense 18.4 25.2 34.0 41.7 52.2 64.2 77.7 86.2 97.5 107.2 112.6 EBIT 27.5 36.0 48.6 66.3 76.7 90.6 100.5 113.2 115.7 113.9 105.5 Net working capital 19.1 31.1 42.0 54.6 72.2 88.8 114.2 134.8 152.3 167.5 175.9 Net PPE 15.7 18.7 24.9 31.9 39.4 47.8 57.1 66.6 74.3 79.8 81.3 number of existing shares number of new shares Flotation cost spread 0.07 Free Cash Flow Valuation Terminal Constant growth rate 4.0% Tax rate WACC Weight of debt Weight of equity Cost of debt Beta (average competitor) Market Risk Premium Riskfree rate Cost of equity 2008 2009 2010 2011 2012 2013 2014 2015 2016 2017 2018 0 1 2 3 4 5 6 7 8 9 10 NOPAT + Depreciation - Capex - Change in NWC Free cash flow Horizon value Discounted value Value of Operations Non-operating Assets 0.0 Debt Intrinsic value of Equity # of existing shares Intrinsic Value per share Implied Offer Price Multiples Valuation 13/14 Forward EBITDA Multiple Multip Intrinsi le for 2009 Implied Equity c value Implie refere Rosetta Rosetta Value per d Offer nce EBITDA EV pre IPO Share Price Your estimate K12, Inc Proposed by Rosetta 8.0
Step by Step Solution
There are 3 Steps involved in it

Get step-by-step solutions from verified subject matter experts