

Question: How do I solve the graph? How is it done then can I get an explanation please? Thank you Percentage Share, 2013 Percentage of Families
How do I solve the graph? How is it done then can I get an explanation please? Thank you
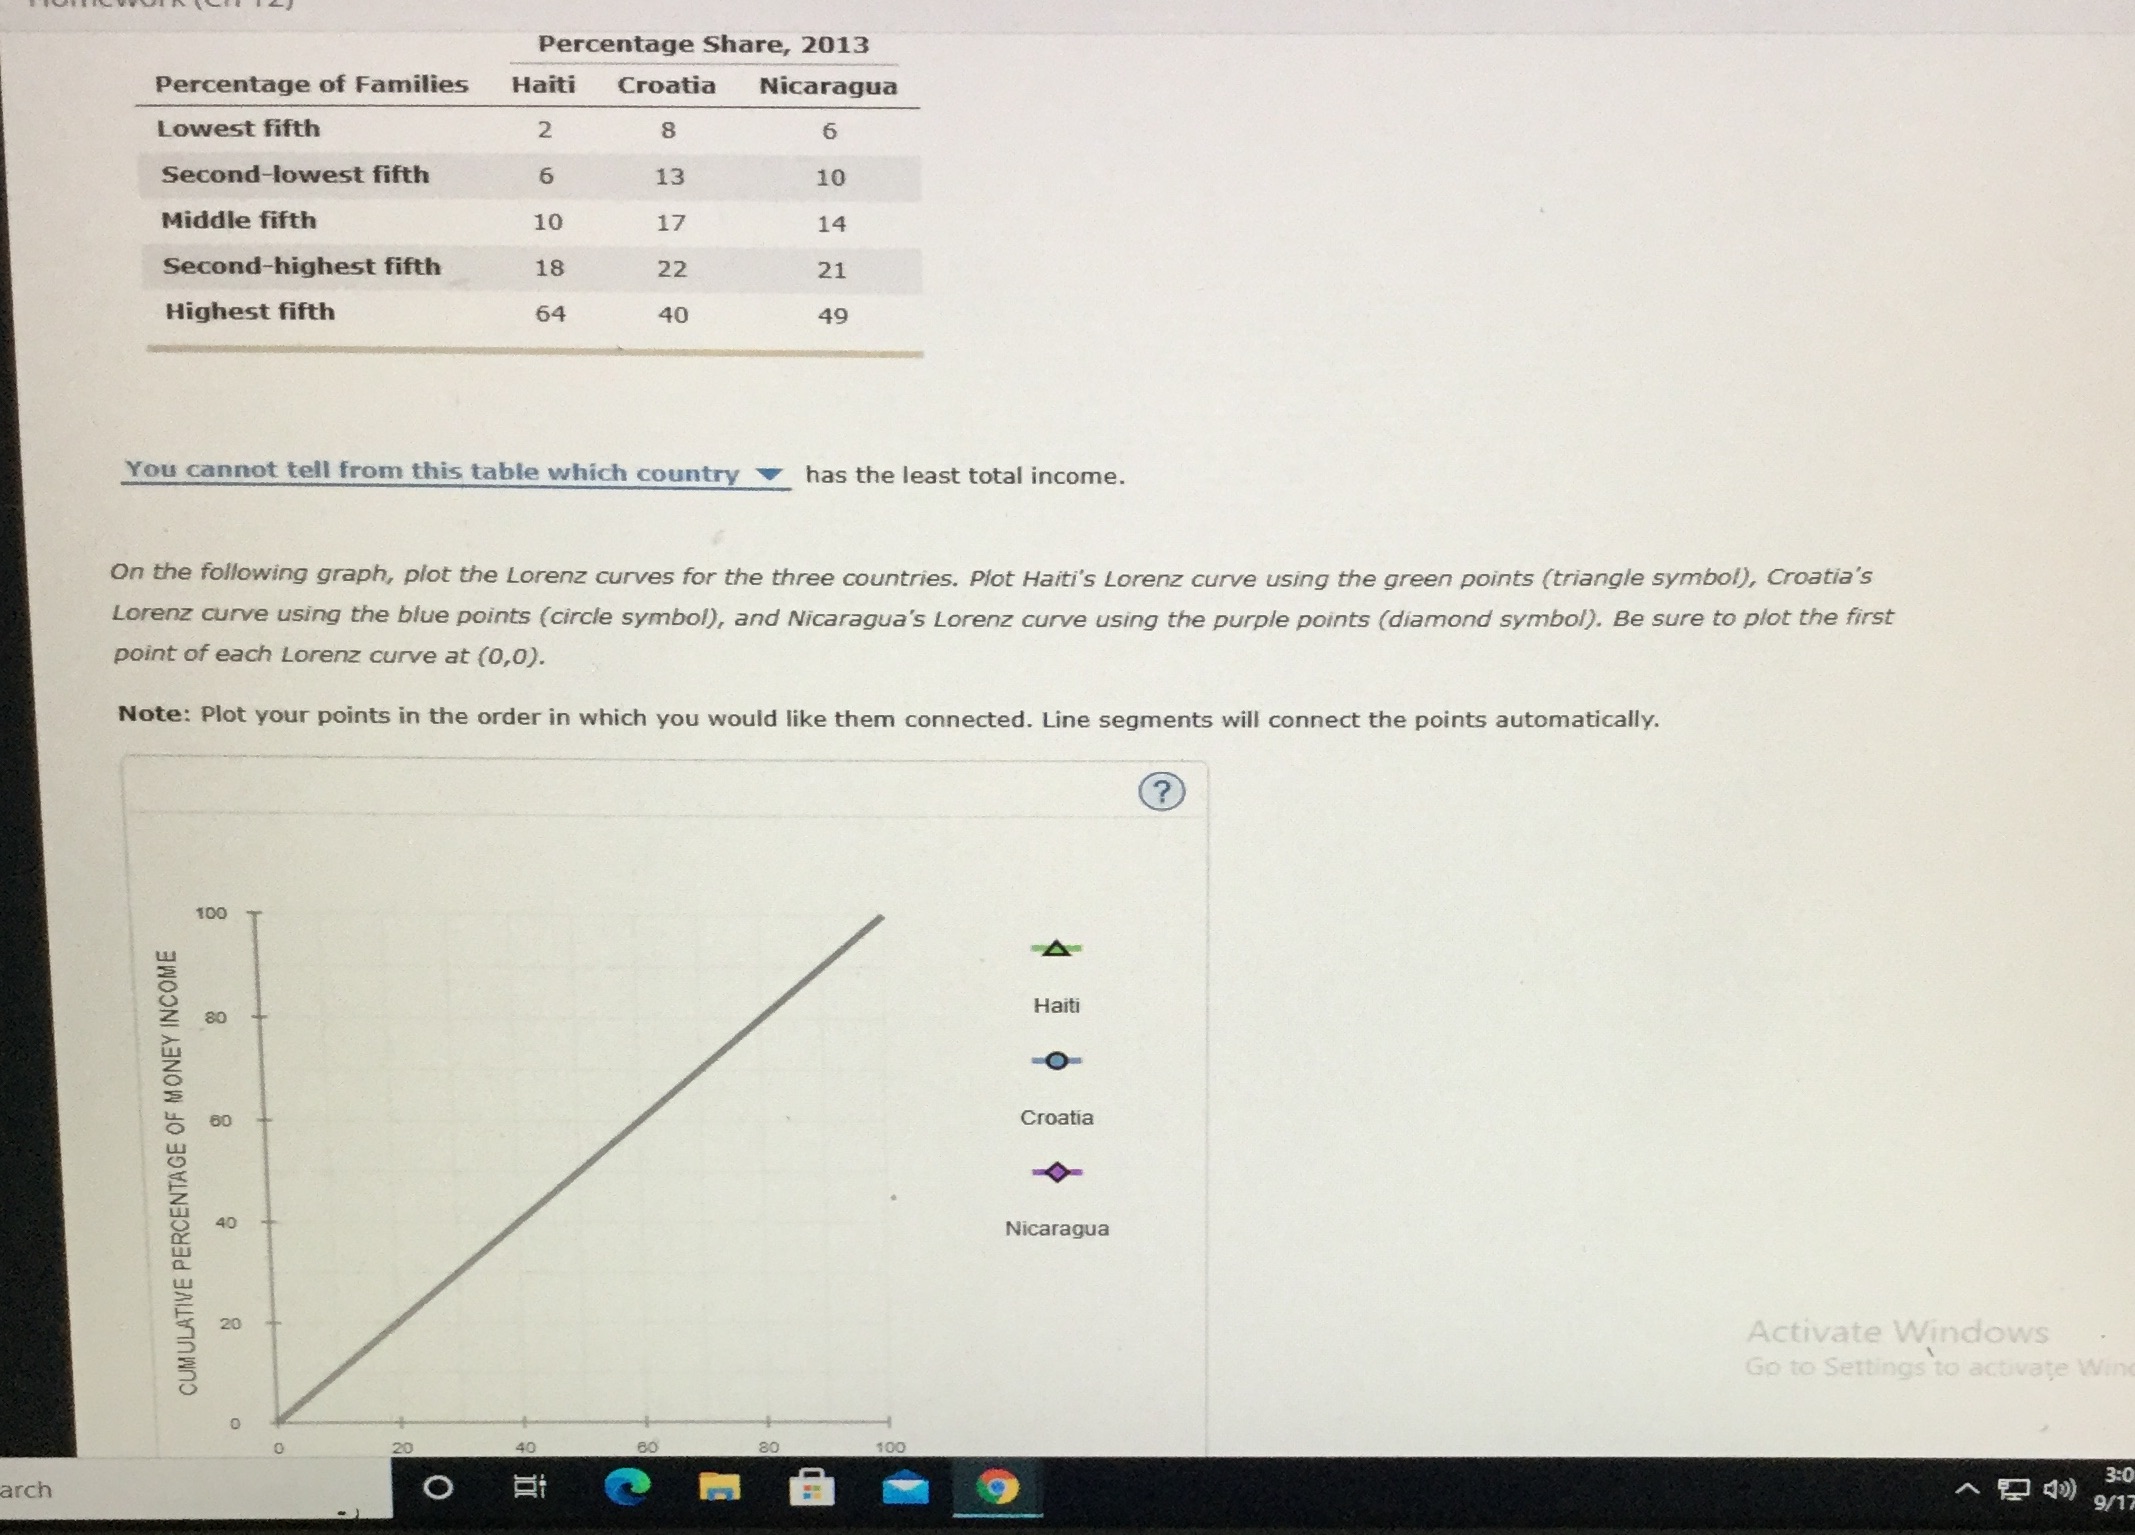
Percentage Share, 2013 Percentage of Families Haiti Croatia Nicaragua Lowest fifth 2 8 6 Second-lowest fifth 6 13 10 Middle fifth 10 17 14 Second-highest fifth 18 22 21 Highest fifth 64 40 49 You cannot tell from this table which country V has the least total income. On the following graph, plot the Lorenz curves for the three countries. Plot Haiti's Lorenz curve using the green points (triangle symbol), Croatia's Lorenz curve using the blue points (circle symbol), and Nicaragua's Lorenz curve using the purple points (diamond symbol). Be sure to plot the first point of each Lorenz curve at (0,0). Note: Plot your points in the order in which you would like them connected. Line segments will connect the points automatically. 100 CUMULATIVE PERCENTAGE OF MONEY INCOME A Haiti 80 O 60 Croatia 10 Nicaragua 20 Activate Windows Go to Settings to activate Win 40 60 80 100 arch O ET 9 3:0 9/1
Step by Step Solution
There are 3 Steps involved in it

Get step-by-step solutions from verified subject matter experts