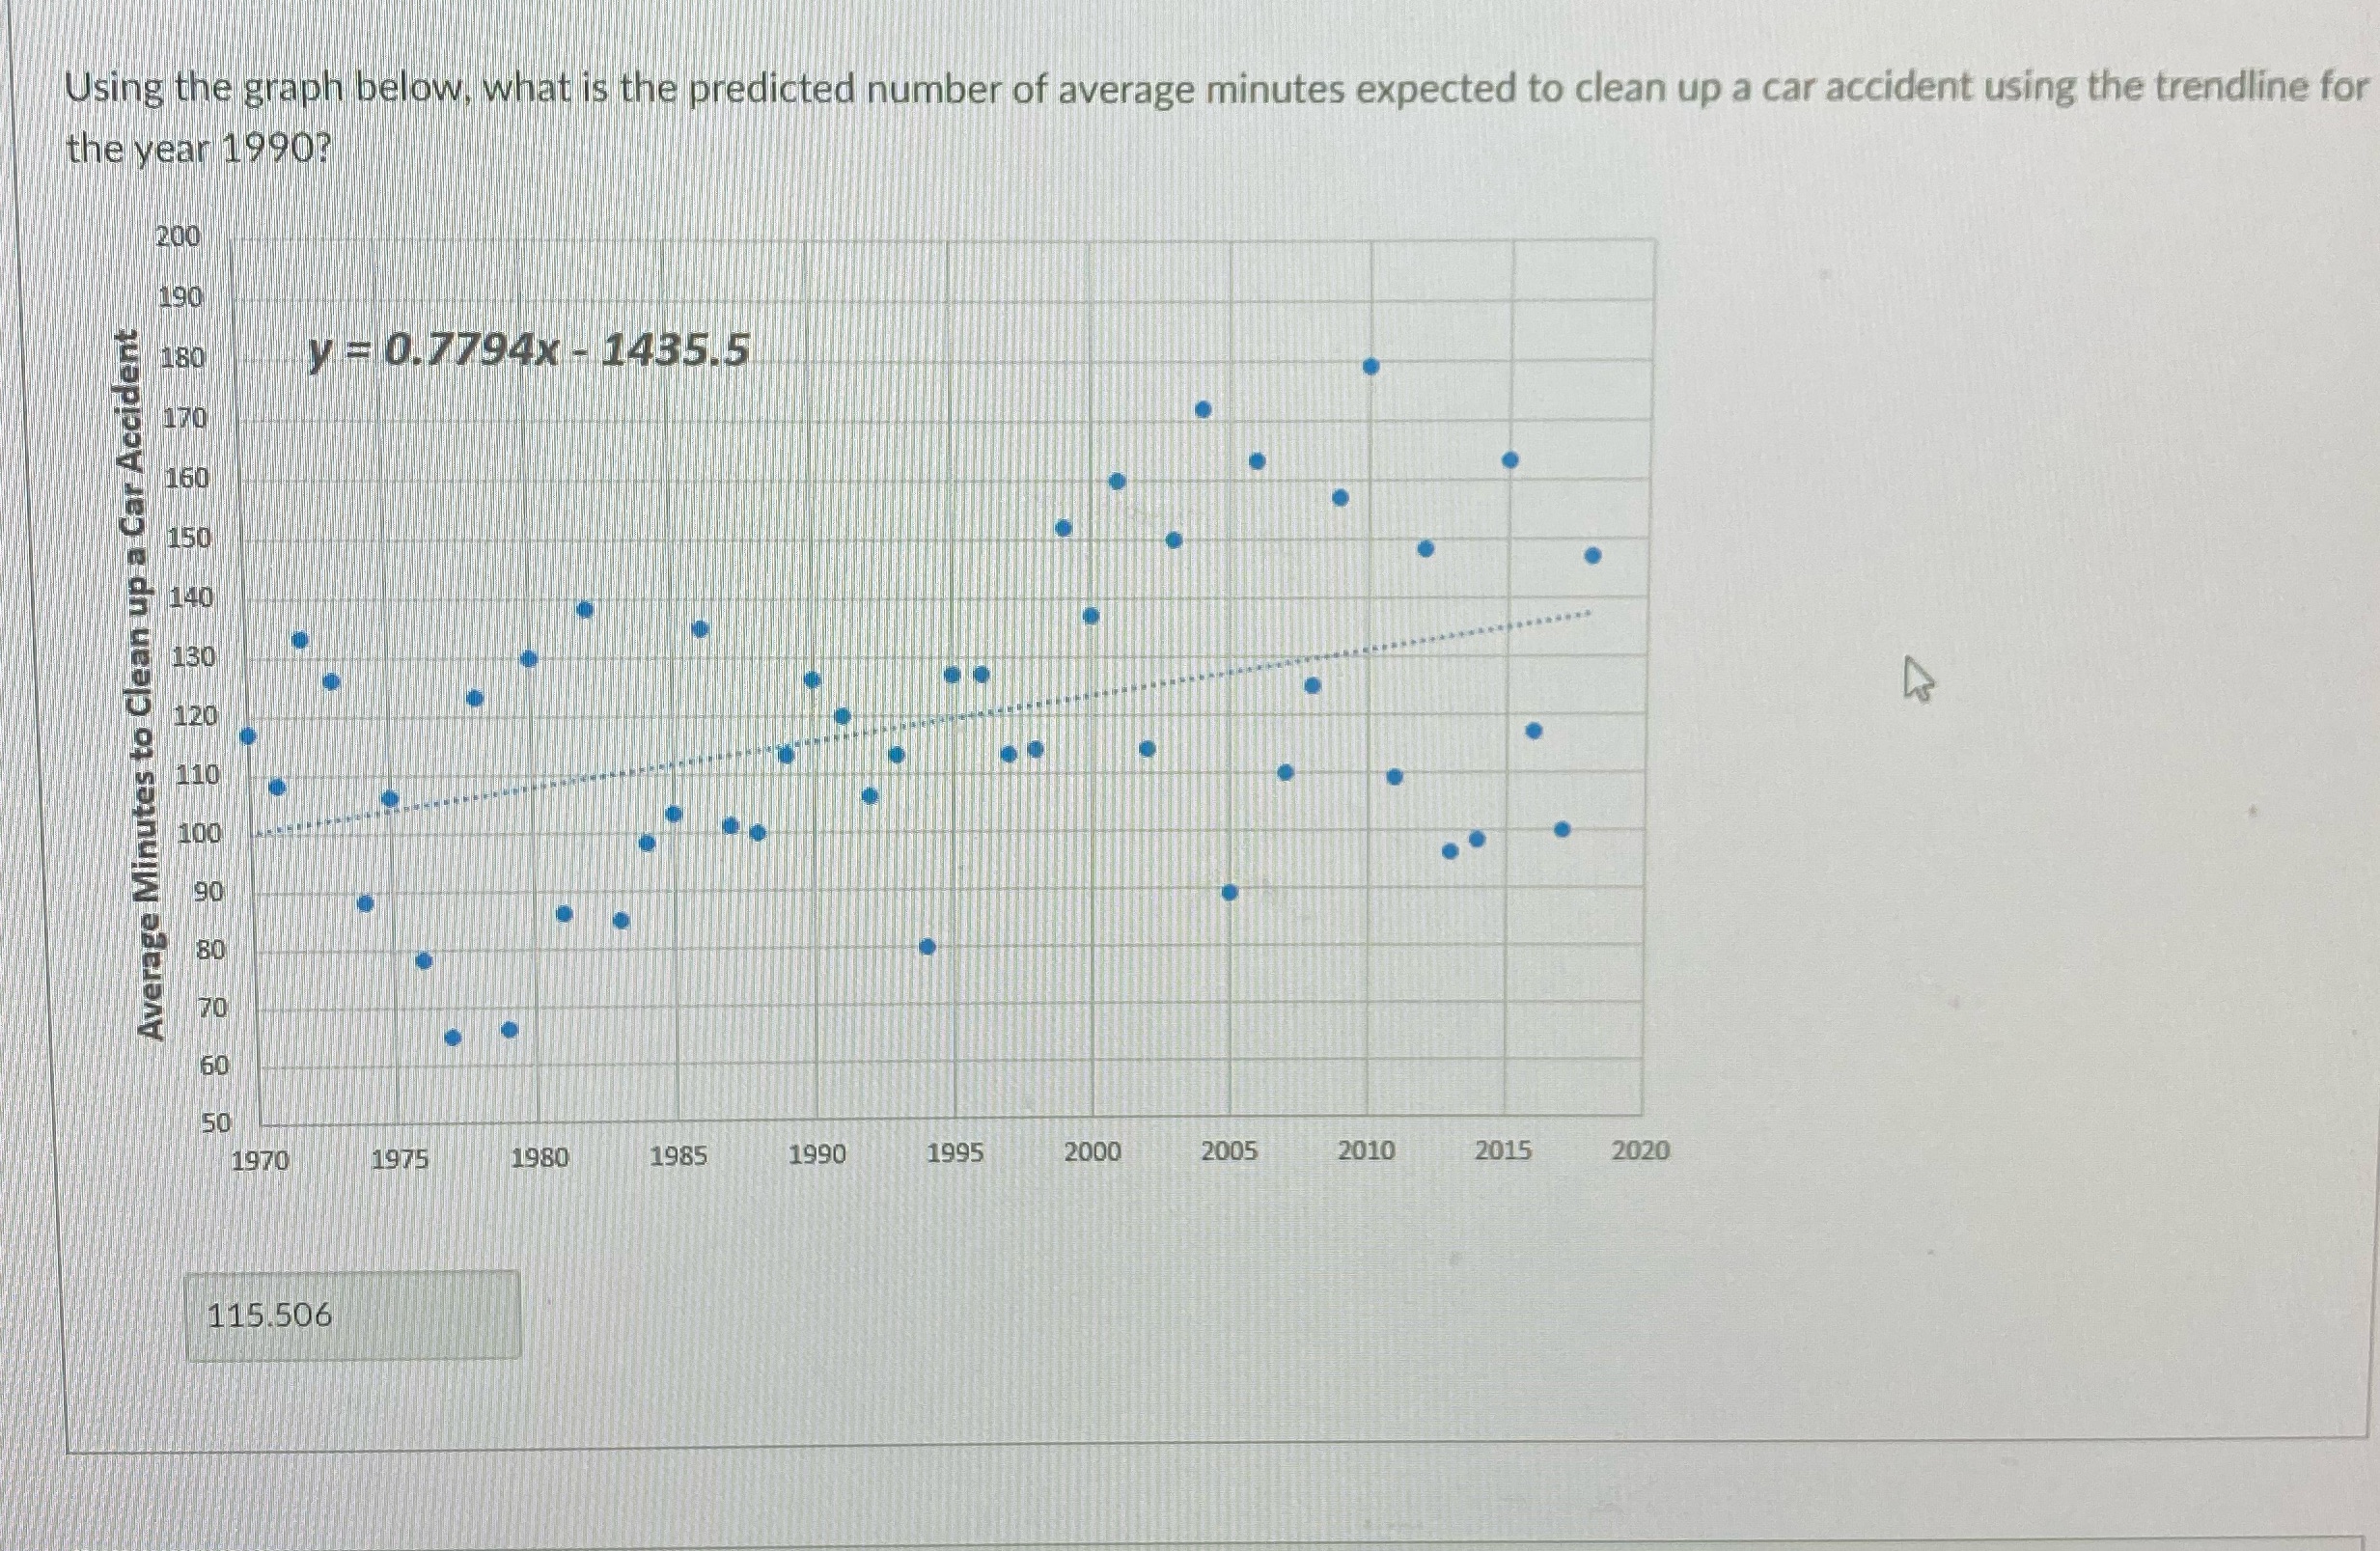
Question: How do I solve this answer? Using the graph below, what is the predicted number of average minutes expected to clean up a car accident

How do I solve this answer?

How do I solve this answer? Using the graph
Using the graph below, what is the predicted number of average minutes expected to clean up a car accident using the trendline for the year 1990? 200 190 180 y =0.7794x - 1435.5 170 160 150 130 Average Minutes to Clean up a Car Accident 120 50 50 1970 1975 1980 1985 1990 1995 2000 2005 2010 2015 2020 115.506

Step by Step Solution

There are 3 Steps involved in it

1 Expert Approved Answer
Step: 1 Unlock blur-text-image
Question Has Been Solved by an Expert!

Get step-by-step solutions from verified subject matter experts

Step: 2 Unlock
Step: 3 Unlock

Students Have Also Explored These Related Mathematics Questions!