

Question: How do I solve this? Homework: HW 3.2 Score: 0 of 1 pt 3 of 6 (2 complete) 3.2.17 The following data represent exam scores
How do I solve this?
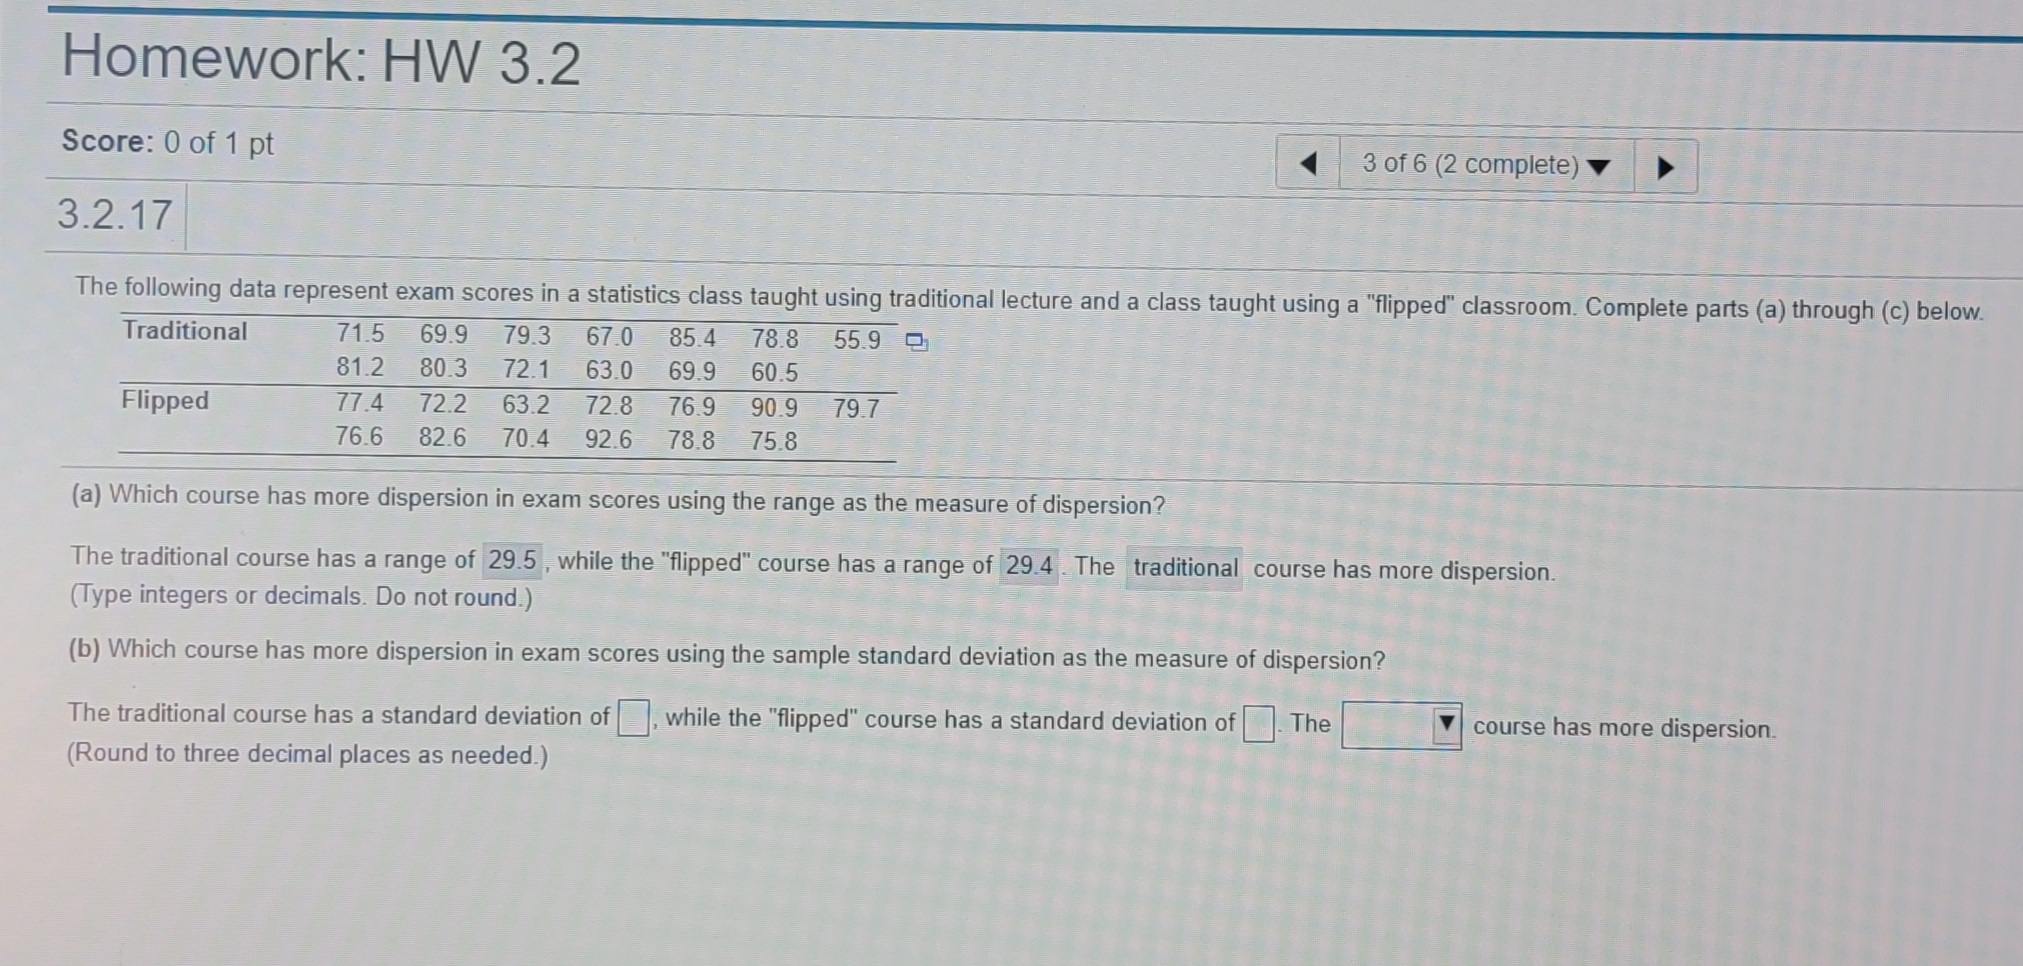
Homework: HW 3.2 Score: 0 of 1 pt 3 of 6 (2 complete) 3.2.17 The following data represent exam scores in a statistics class taught using traditional lecture and a class taught using a "flipped" classroom. Complete parts (a) through (c) below. Traditional 71.5 69.9 79.3 67.0 85.4 78.8 55.9 0 81.2 80.3 72.1 63.0 69.9 60.5 Flipped 77.4 72.2 63.2 72.8 76.9 90.9 79.7 76.6 82.6 70.4 92.6 78.8 75.8 (a) Which course has more dispersion in exam scores using the range as the measure of dispersion? The traditional course has a range of 29.5 , while the "flipped" course has a range of 29.4 . The traditional course has more dispersion. (Type integers or decimals. Do not round.) (b) Which course has more dispersion in exam scores using the sample standard deviation as the measure of dispersion? The traditional course has a standard deviation of , while the "flipped" course has a standard deviation of The course has more dispersion. (Round to three decimal places as needed.)
Step by Step Solution
There are 3 Steps involved in it

Get step-by-step solutions from verified subject matter experts