

Question: How do I solve this question? This is the entire exact question given in the assignment. (a) Using the regression data in the table above,
How do I solve this question? This is the entire exact question given in the assignment.
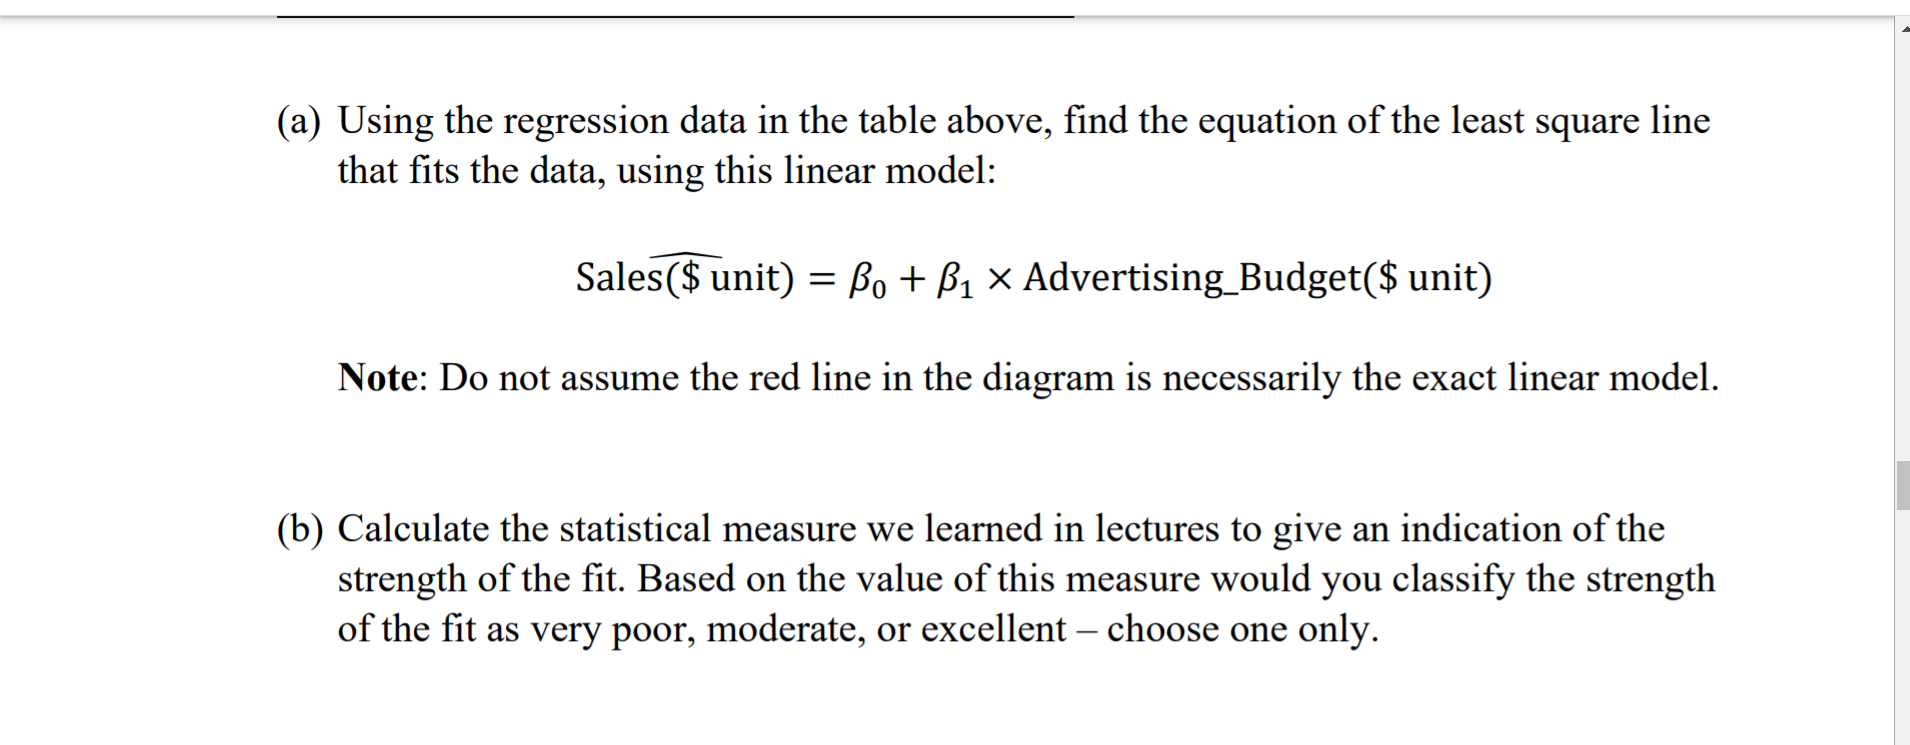
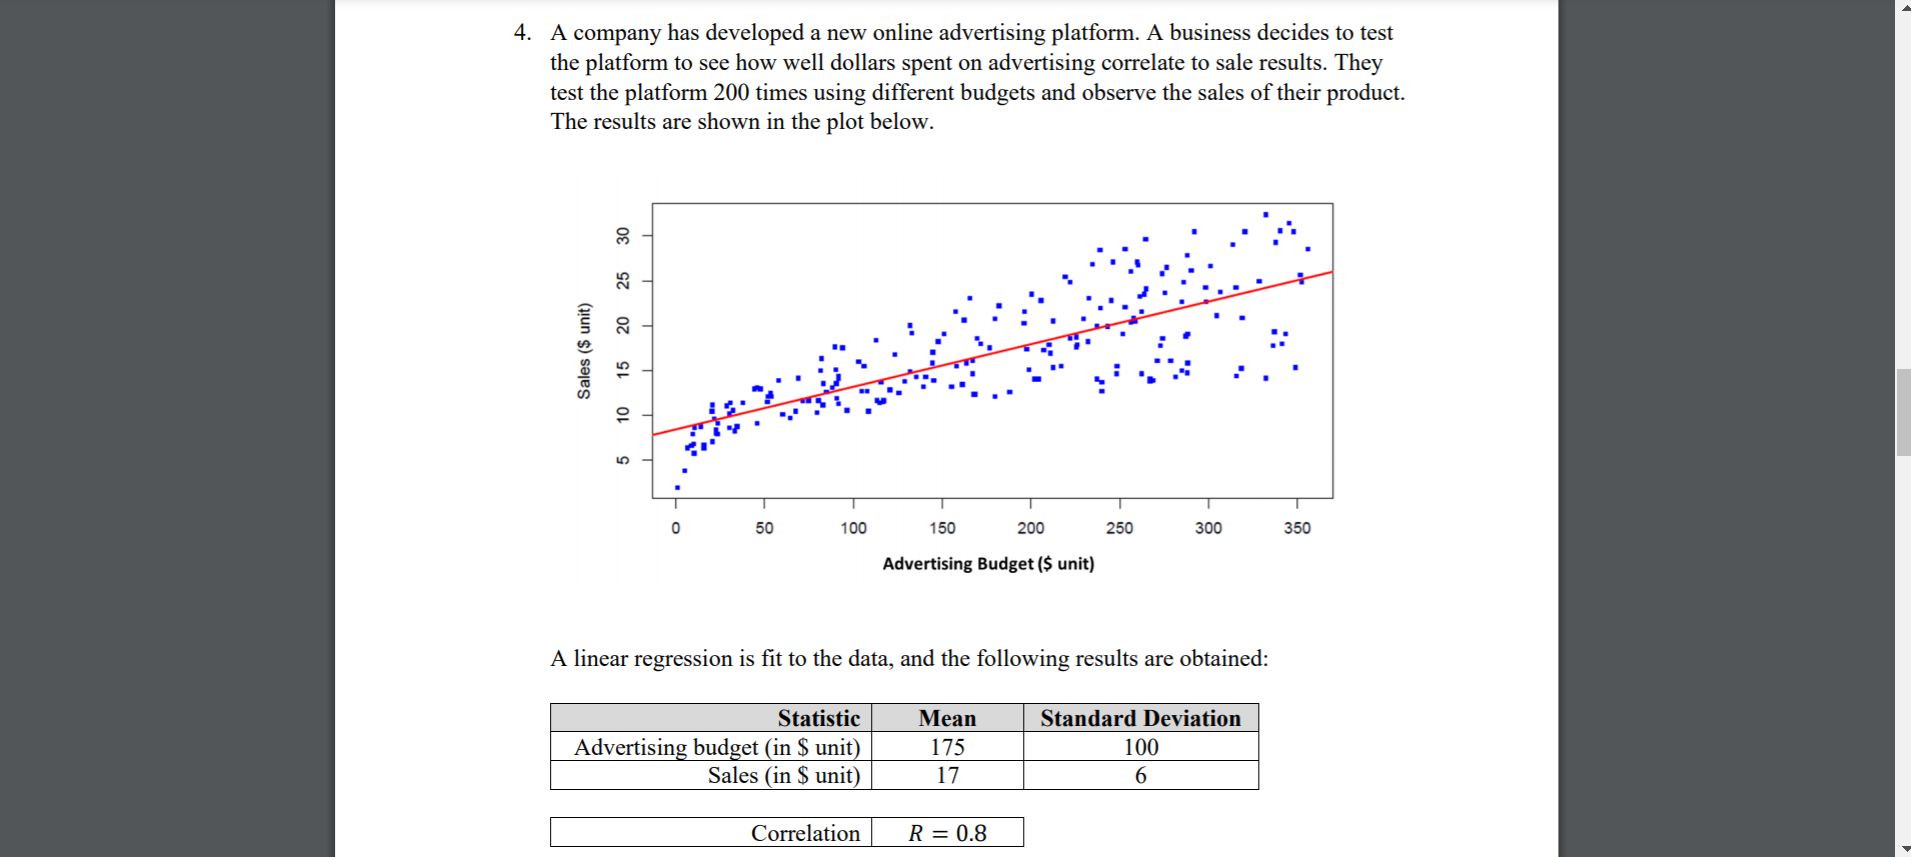
(a) Using the regression data in the table above, nd the equation of the least square line that ts the data, using this linear model: Sales($ unit) 2 [0 + [1 x Advertising_Budget($ unit) Note: Do not assume the red line in the diagram is necessarily the exact linear model. (b) Calculate the statistical measure we learned in lectures to give an indication of the strength of the t. Based on the value of this measure would you classify the strength of the t as very poor, moderate, or excellent choose one only. 4. A company has developed a new online advertising platform. A business decides to test the platform to see how well dollars spent on advertising correlate to sale results. They test the platform 200 times using different budgets and observe the sales of their product. The results are shown in the plot below. 25 20 Sale: (5 unit) 15 10 5 0 50 1 00 150 200 250 300 350 Advertising Budget (5 unit) A linear regression is t to the data, and the following results are obtained: Statistic Mean Smdard Deviation Advertising budget (in $ unit) 175 100 Sales (in $ unit) 17 6 Correlation R = 0.8 I (c) If the nal advertising budget the business decides to deploy is $200 (in $ unit), what would be their expected sales when using this new platform? (d) As an expert data modeler observing the regression fit above (approximately the red line), would you have any concerns about the accuracy of the predictions from the linear model? Be brief, precise and technical in your
Step by Step Solution
There are 3 Steps involved in it

Get step-by-step solutions from verified subject matter experts