

Question: How do I use the Clausius clapeyron equation to plot ln P vs. 1/T please The Clausius-Clapeyron equation describes the relationship between vapor pressure and
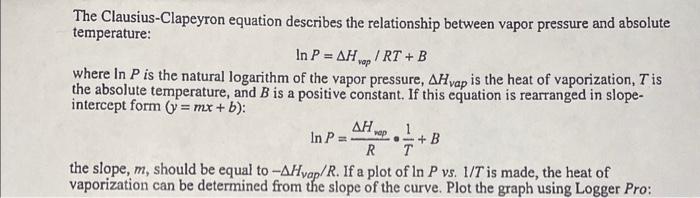
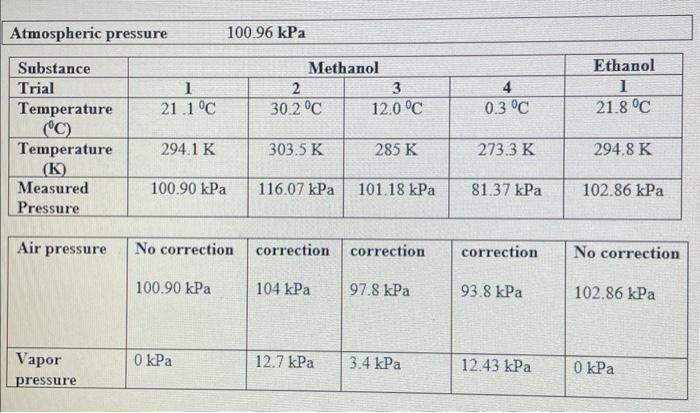
The Clausius-Clapeyron equation describes the relationship between vapor pressure and absolute temperature: lnP=Hvop/RT+B where lnP is the natural logarithm of the vapor pressure, Hvap is the heat of vaporization, T is the absolute temperature, and B is a positive constant. If this equation is rearranged in slopeintercept form (y=mx+b) : lnP=RHrepT1+B the slope, m, should be equal to Hvap/R. If a plot of lnPvs.1/T is made, the heat of vaporization can be determined from the slope of the curve. Plot the graph using Logger Pro: Atmospheric pressure 100.96kPa \begin{tabular}{|l|c|c|c|c|c|} \hline Substance & \multicolumn{2}{|c|}{ Methanol } & & Ethanol \\ \hline Trial & 1 & 2 & 3 & 4 & 1 \\ \hline Temperature(0C) & 21.1C & 30.2C & 12.0C & 0.3C & 21.8C \\ \hline Temperature(K) & 294.1K & 303.5K & 285K & 273.3K & 294.8K \\ \hline MeasuredPressure & 100.90kPa & 116.07kPa & 101.18kPa & 81.37kPa & 102.86kPa \\ \hline \end{tabular} \begin{tabular}{|l|l|l|l|l|l|} \hline Air pressure & No correction & correction & correction & correction & No correction \\ & 100.90kPa & 104kPa & 97.8kPa & 93.8kPa & 102.86kPa \\ \hline Vaporpressure & 0kPa & 12.7kPa & 3.4kPa & 12.43kPa & 0kPa \\ \hline \end{tabular}
Step by Step Solution
There are 3 Steps involved in it

Get step-by-step solutions from verified subject matter experts