

Question: how do I use this data from the case, the forecast model provided, and the spreadsheet to a make a forecast surrounding the new product
how do I use this data from the case, the forecast model provided, and the spreadsheet to a make a forecast surrounding the new product concept. I will need to expand the spreadsheet to deal with all of the data in Exhibit 5 (varying repeat rates and levels of awareness and ACV), and forecast 9 scenarios (for each of mediocre, average, excellent quality - do scenarios for low/low, medium/medium and high/high awareness and ACV).
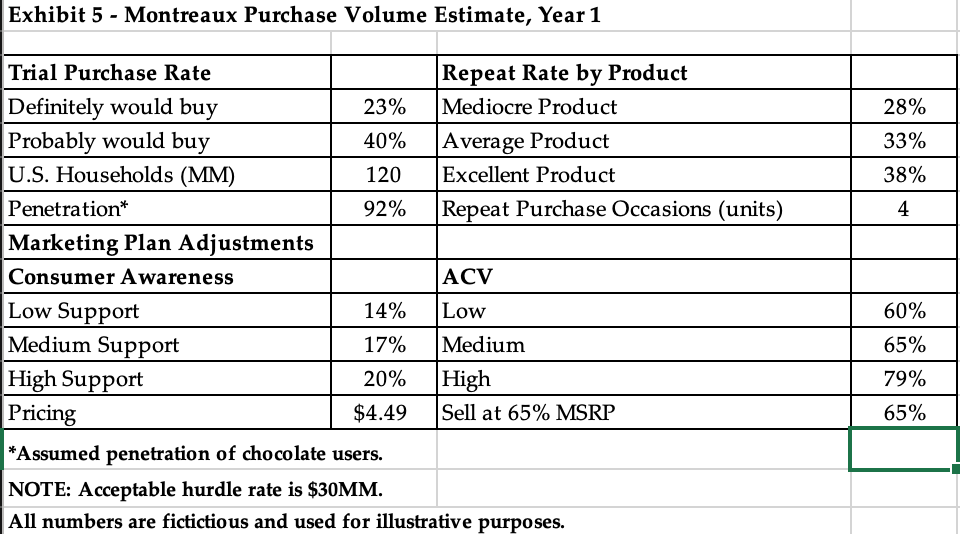
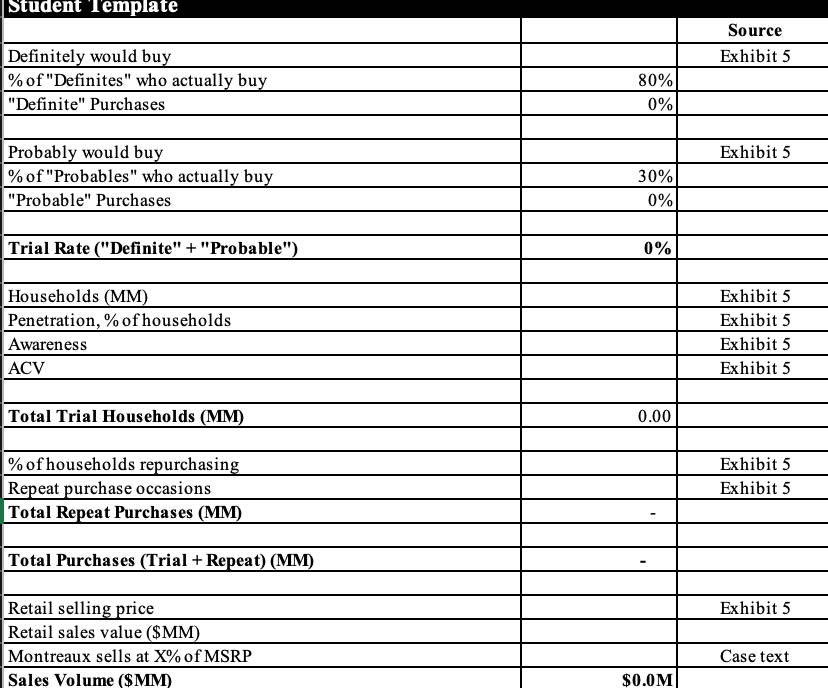
Exhibit 5 - Montreaux Purchase Volume Estimate, Year 1 Trial Purchase Rate Definitely would buy Probably would buy U.S. Households (MM) Penetrationt Marketing Plan Adjustments Repeat Rate by Product Mediocre Product Average Product Excellent Product Repeat Purchase Occasions (units) 23% 40% 120 92% {b ox IF CV Low 17% Medium 20% High $4.49 Sell at 65% MSRP Consumer Awareness 14% (2.} Low Support Medium Support High Support i "Assumed penetration of chocolate users. NOTE: Acceptable hurdle rate is $30MM. All numbers are fictictious and used for illustrative purposes Student Template Source Definitely would buy Exhibit 5 % of "Definites" who actually buy 80% "Definite" Purchases 0% Probably would buy Exhibit 5 % of "Probables" who actually buy 30% "Probable" Purchases 0% Trial Rate ("Definite" + "Probable") 0% Households (MM) Exhibit 5 Penetration, % of households Exhibit 5 Awareness Exhibit 5 ACV Exhibit 5 Total Trial Households (MM) 0.00 % of households repurchasing Exhibit 5 Repeat purchase occasions Exhibit 5 Total Repeat Purchases (MM) Total Purchases (Trial + Repeat) (MM) Retail selling price Exhibit 5 Retail sales value ($MM) Montreaux sells at X% of MSRP Case text Sales Volume ($MM) $0.OM
Step by Step Solution
There are 3 Steps involved in it

Get step-by-step solutions from verified subject matter experts