

Question: how do I work these? 14.20 Use the data given in Figure 14.10 and duplicate the chart shown there. 14.21 Use Excel to plot the
how do I work these?
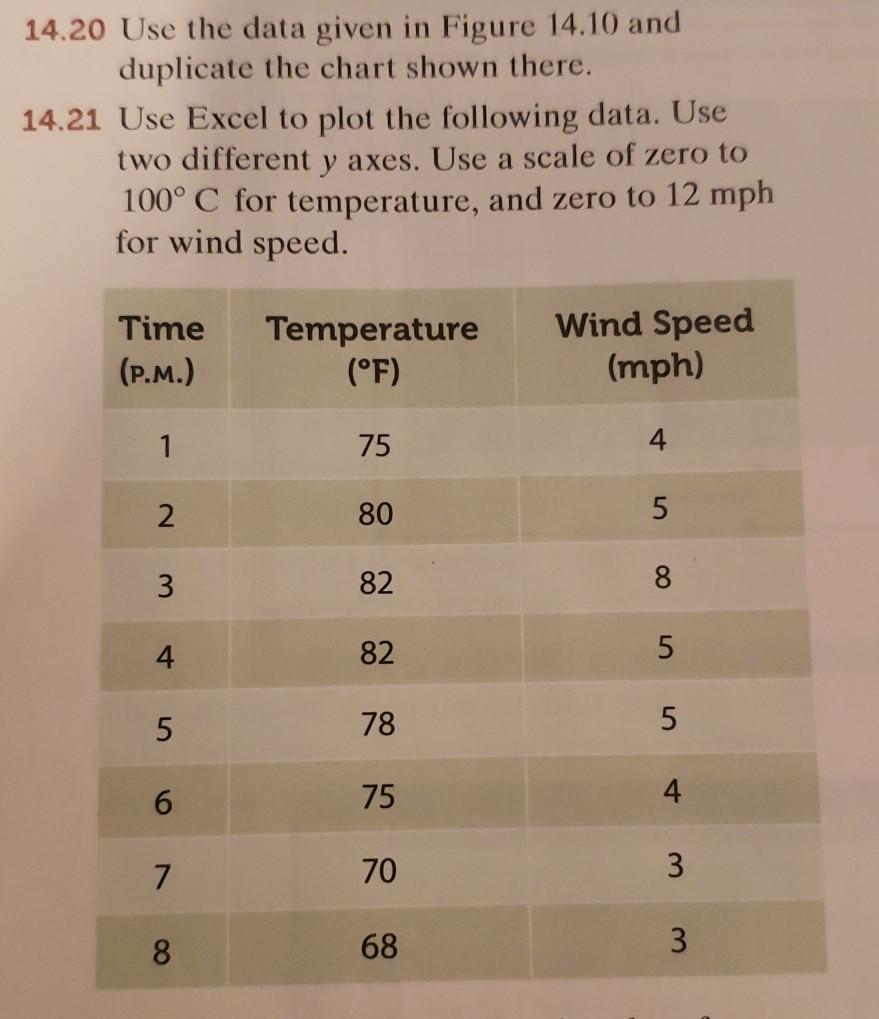
14.20 Use the data given in Figure 14.10 and duplicate the chart shown there. 14.21 Use Excel to plot the following data. Use two different y axes. Use a scale of zero to 100 C for temperature, and zero to 12 mph for wind speed. Time (P.M.) Temperature (F) Wind Speed (mph) 1 75 4 2 80 5 3 82 8 4 82 5 5 78 5 6 75 4 7 70 3 8 68 3
Step by Step Solution
There are 3 Steps involved in it
1 Expert Approved Answer
Step: 1 Unlock

Question Has Been Solved by an Expert!
Get step-by-step solutions from verified subject matter experts
Step: 2 Unlock
Step: 3 Unlock