

Question: How do I write these results in APA format? A regression analysis was computed to determine whether the number of days spent in a refugee
How do I write these results in APA format?
A regression analysis was computed to determine whether the number of days spent in a refugee camp predictstrauma levelsin recently resettled refugees. The results indicate a significant positive relationship between the variables, r(18) = .882, p = .000. The equation for the regression is ? = .014x + .079, or trauma level scores in recently resettled refugees = .014(number of days spent in a refugee camp) + .079. The standard error of estimate provided for the regression line is .471, indicating that the data points lie close to the regression line. The confidence interval for the slope ranged from -.439 to .597, an interval which contains the value 0. r squared = .777, indicating that 77.7% of the variance in trauma level scores is explained by the number of days spent in refugee camps. The results of the ANOVA were significant, F(1, 15) = 52.383, p = .000. We must reject the null hypothesis that the slop of our regression line is 0 and conclude that the number of days spent in refugee camps does significantly predict trauma level scores in recently resettled refugees.
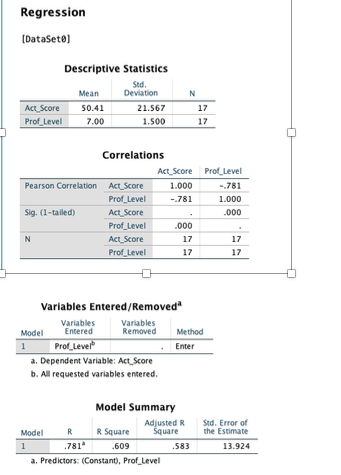
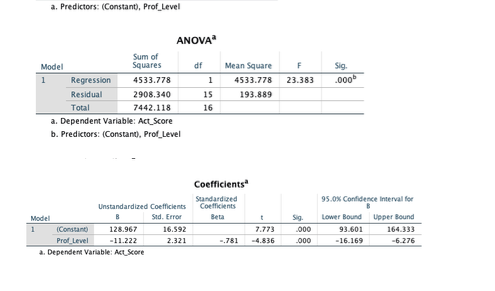
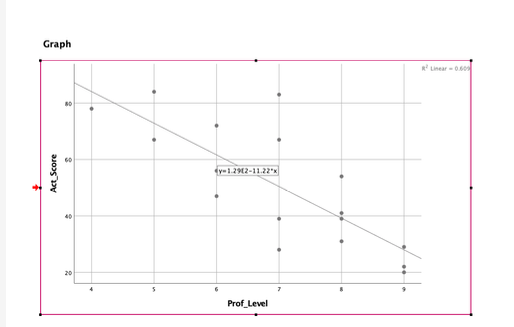
Regression [DataSete] Descriptive Statistics Mean Deviation Act_Score 50.41 21.567 17 Prof Level 7.00 1.500 17 Correlations Act_Score Prof Level Pearson Correlation Act_Score 1.000 -.781 Prof_Level -.781 1.000 Sig. (1-tailed) Act Score 000 Prof Level N Act_Score 17 17 Prof Level 17 17 Variables Entered/Removed" Variables Variables Model Entered Removed Method 1 Prof_Level Enter a, Dependent Variable; Act_Score b. Al requested variables entered. Model Summary Adjusted R Sad, Error of Model R R. Square Square the Estimate 1 .781" .609 583 13.924 a. Predictors: (Constant), Prof_Levela. Predictors: (Constant), Prof_Level ANOVA Sum of Model Squares dif Mean Square F Sig. 1 Regression 4533.778 1 4533.778 23.383 .000 Residual 2908.340 15 193.889 Total 7442.118 16 a. Dependent Variable: Act_Score b. Predictors: (Constant), Prof_Level Coefficients" Sundardared Unstandardized Coefficients 95 0% Confidence Interval for Model B Sad. Error Lower Bound Upper Bound 1 Conting 128.967 16.592 7.773 500 93 601 Prof Level -11.222 -.781 14.836 000 -16.169 -6 276 A. Dependent Variable: Act_Score\f
Step by Step Solution
There are 3 Steps involved in it

Get step-by-step solutions from verified subject matter experts