

Question: How do the formants for the vowels measured compare with similar vowels in English, based on values given in the textbook (Chapter 8)? Image underneath
How do the formants for the vowels measured compare with similar vowels in English, based on values given in the textbook (Chapter 8)? Image underneath from F1 and F2 values i found with the coordinating graph.
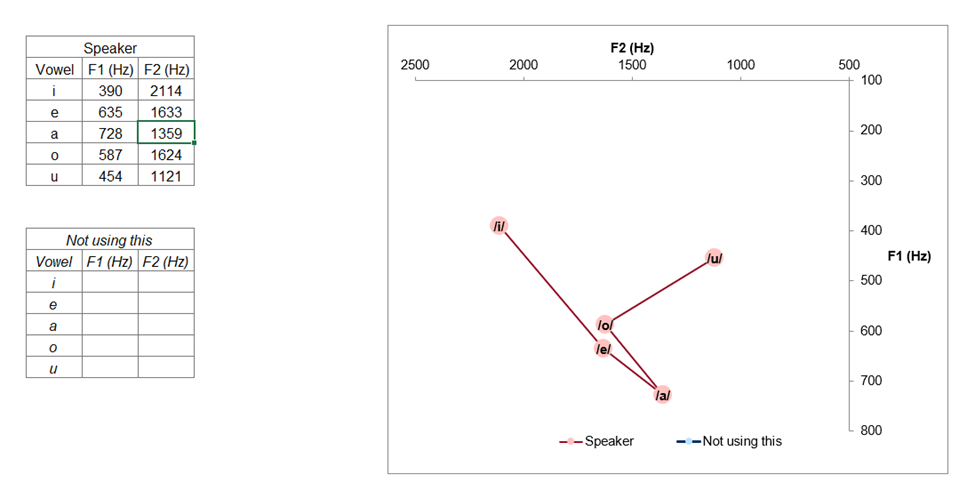
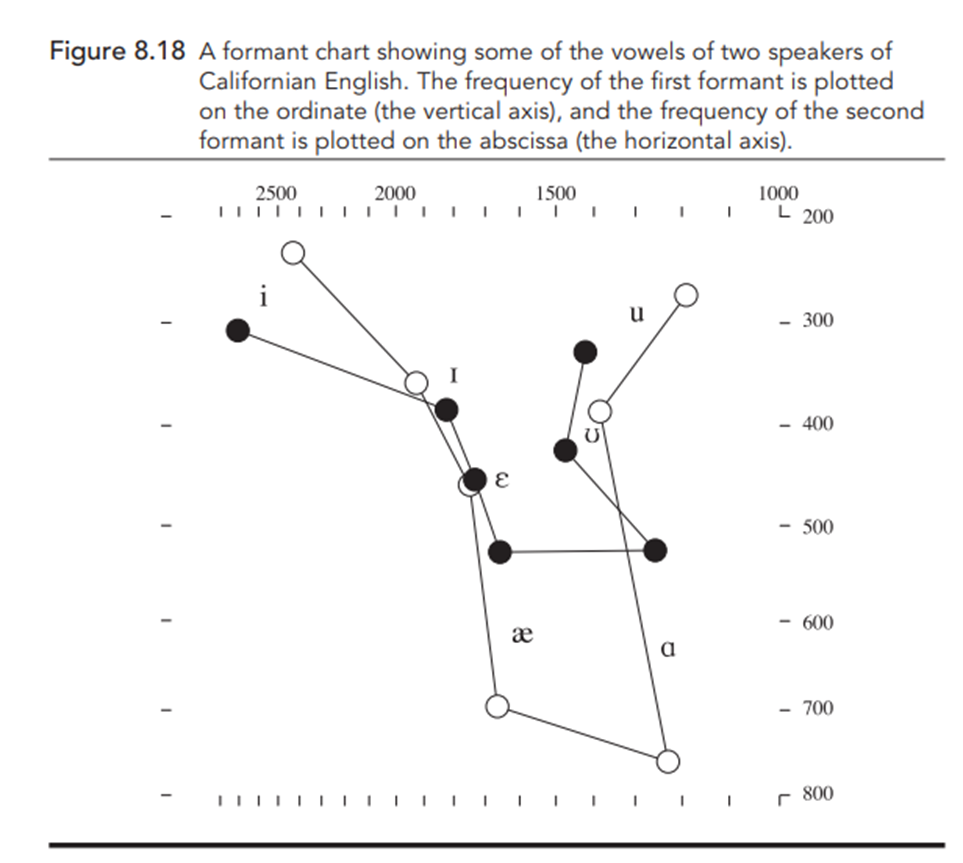
Speaker F2 (Hz) Vowel F1 (Hz) F2 (Hz) 2500 2000 1500 1000 500 100 390 2114 e 635 1633 a 728 1359 200 0 587 1624 U 454 1121 300 400 Not using this Vowel F1 (Hz) F2 (Hz) F1 (Hz) 500 e a 600 lel U 700 lal 800 --Speaker - -Not using thisFigure 8.18 A formant chart showing some of the vowels of two speakers of Californian English. The frequency of the first formant is plotted on the ordinate (the vertical axis), and the frequency of the second formant is plotted on the abscissa (the horizontal axis). 2500 2000 1500 1000 I L 200 O u - 300 - 400 - 500 - 600 ae a - 700 IIIIIII 800
Step by Step Solution
There are 3 Steps involved in it

Get step-by-step solutions from verified subject matter experts