Question: How do we do part c of this question for x-r chart 1 Sample IX R Sample R 1 2 3 4 5 6 7

How do we do part c of this question for x-r chartHow do we do part c of this question for x-r

1 Sample IX R Sample R 1 2 3 4 5 6 7 8 9 10 80.2 79.1 83.2 81.0 77.6 81.7 80.4 77.5 79.8 85.3 77.7 82.3 79.5 7.2 9.0 4.7 5.6 10.1 8.6 4.4 6.2 7.9 7.1 9.8 10.7 9.2 14 15 16 17 18 19 20 21 22 23 24 25 83.1 79.6 80.0 83.2 75.9 78.1 81.4 81.7 80.9 78.4 79.6 81.6 10.2 7.8 6.1 8.4 9.9 6.0 7.4 10.4 9.1 7.3 8.0 7.6 11 12 13 a. Calculate the mean of the sample means, 7, and the mean of the sample ranges, R. b. Calculate and plot the centerline and the upper and lower control limits for the x-chart. c. Calculate and plot the A, B, and C zone boundaries of the x-chart. 1 Sample IX R Sample R 1 2 3 4 5 6 7 8 9 10 80.2 79.1 83.2 81.0 77.6 81.7 80.4 77.5 79.8 85.3 77.7 82.3 79.5 7.2 9.0 4.7 5.6 10.1 8.6 4.4 6.2 7.9 7.1 9.8 10.7 9.2 14 15 16 17 18 19 20 21 22 23 24 25 83.1 79.6 80.0 83.2 75.9 78.1 81.4 81.7 80.9 78.4 79.6 81.6 10.2 7.8 6.1 8.4 9.9 6.0 7.4 10.4 9.1 7.3 8.0 7.6 11 12 13 a. Calculate the mean of the sample means, 7, and the mean of the sample ranges, R. b. Calculate and plot the centerline and the upper and lower control limits for the x-chart. c. Calculate and plot the A, B, and C zone boundaries of the x-chart

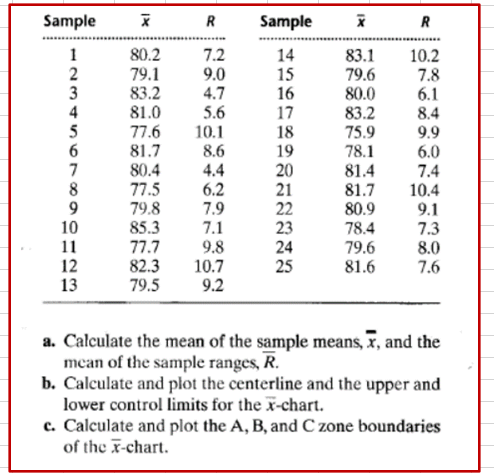
Step by Step Solution

There are 3 Steps involved in it

1 Expert Approved Answer
Step: 1 Unlock blur-text-image
Question Has Been Solved by an Expert!

Get step-by-step solutions from verified subject matter experts

Step: 2 Unlock
Step: 3 Unlock

Students Have Also Explored These Related General Management Questions!