

Question: how do we find debt equity ratio for 2017 with limited info and what formula use 2015 E 2000 Balance Sheet Data Cash and cash
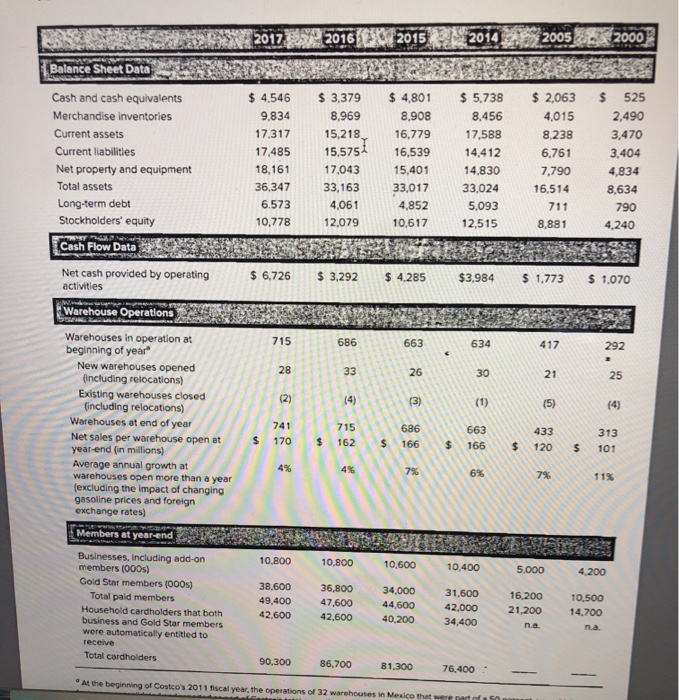
2015 E 2000 Balance Sheet Data Cash and cash equivalents $ 4,546 $ 3.379 $ 4,801 $ 5.738 $ 2.063 $ 525 Merchandise inventories 9,834 8,969 8,908 8.456 4.015 2,490 Current assets 17.317 15,218 16.779 17,588 8.238 3,470 Current liabilities 17,485 15,5751 16,539 14,412 6,761 3,404 Net property and equipment 18,161 17,043 15,401 14,830 7.790 4,834 Total assets 36,347 33,163 33,017 33,024 16,514 8,634 Long-term debt 6.573 4,061 4,852 5,093 711 790 Stockholders' equity 10,778 12,079 10,617 12,515 8,881 4,240 Cash Flow Data S AESSENYESANAT Net cash provided by operating $ 6,726 $ 3.292 $ 4,285 $3,984 $ 1.773 $ 1.070 activities Warehouse Operations 663 634 Warehouses in operation at beginning of year New warehouses opened (including relocations) Existing warehouses closed (including relocations) Warehouses at end of year Net sales per warehouse open at year-end (in millions) Average annual growth at warehouses open more than a year (excluding the impact of changing gasoline prices and foreign exchange rates) . $ O $ 166 Members at year-end 10,800 10,800 Businesses, including add-on members (000s) Gold Star members (OOO) Total paid members Household cardholders that both business and Gold Star members were automatically entitled to receive Total cardholders 38,600 49,400 42.600 36,800 47,600 42,600 10.500 34.000 44,600 40,200 10.400 31,500 42.000 34,400 5,000 16,200 21,200 4.200 10.500 14.700 90.300 86,700 81.300 76,400 -- *M the beginning of Costco's 2011 fiscal year, the operations of 32 warehouses in Mexico that were
Step by Step Solution
There are 3 Steps involved in it

Get step-by-step solutions from verified subject matter experts