

Question: How do we solve problem 14??? Included additional information above and below. corporate income tax. KMS pays a 35% tax rate 10-year coupon bonds with
How do we solve problem 14??? Included additional information above and below.
corporate income tax. KMS pays a 35% tax rate 10-year coupon bonds with a coupon rate of 6.8%.
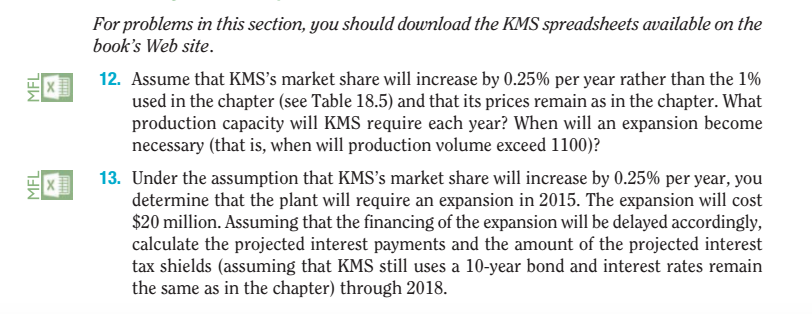
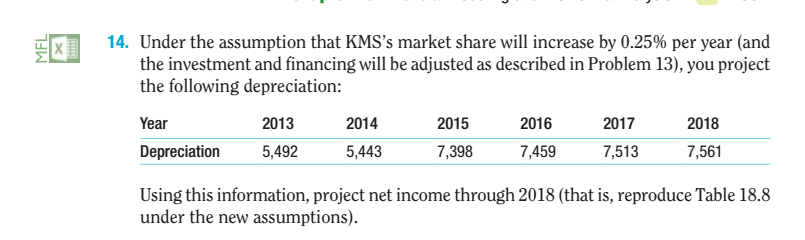
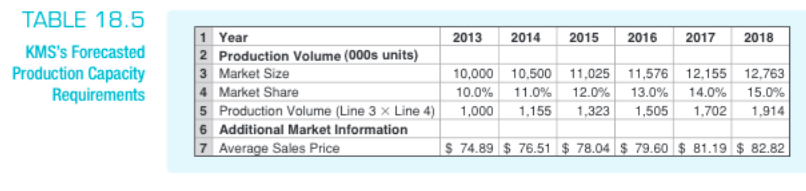
For problems in this section, you should download the KMS spreadsheets available on the book's Web site. 12. Assume that KMS's market share will increase by 0.25% per year rather than the 1% used in the chapter (see Table 18.5) and that its prices remain as in the chapter. What production capacity will KMS require each year? When will an expansion become necessary (that is, when will production volume exceed 1100)? 13. Under the assumption that KMS's market share will increase by 0.25% per year, you determine that the plant will require an expansion in 2015. The expansion will cost $20 million. Assuming that the financing of the expansion will be delayed accordingly, calculate the projected interest payments and the amount of the projected interest tax shields (assuming that KMS still uses a 10-year bond and interest rates remain dde ine that the plant will rquire an expansion in,2015 The esnd the same as in the chapter) through 2018 14. Under the assumption that KS's marketshare will increase by 0.25% per year (and the investment and financing will be adjusted as described in Problem 13), you project the following depreciation: Year 2013 2014 2015 2016 2017 2018 Depreciation 5,492 5,443 7,398 7,4597,513 7,561 Using this information, project net income through 2018 (that is, reproduce Table 18.8 under the new assumptions) TABLE 18.5 KMS's Forecasted Production Capacity Requirements 1 Year 20132014 2015 2016 2017 2018 2 Production Volume (000s units) 3 Market Size 0,000 10,500 11,025 11,576 12,155 12,763 10.0% 11.0% 12.0% 13.0% 14.0% 15.0% Market Share Production Volume (Line 3 Additional Market Information 5 Line 4)| 1,000 1.155 . 1.323| 1,505| 1,702 1,914 7 Average Sales Price S 74.89 S 76.51 $ 78.04 $ 79.60 $ 81.19 82.82 TABLE 18.8 Pro Forma Income Statement for KMS Expansion 1 Year 2 Income Statement ($000s 3 Sales 4 Costs Except Depreciation 5 EBITDA 2013 2014 2015 2016 2017 2018 74,889 88,369 103,247 119,793 138,167 158,546 58,413- 68,928-80,533-93.438-107,770-123,666 6,47619,441 22,714 26.354 30,397 34,880 5,492-7,443-7,498-7,5497,594-7,634 0,984 11,998 15,216 18,806 22,803 27,246 306-1,666-1,666-1.666-1,666 0,678 11,692 13,550 17,140 21,137 25,580 3,737-4,092-4,7425,999-7.398-8,953 6,9417,600 8,807 11,141 13.739 16,627 Depreciation 7 EBIT Interest Expense (net) 9 Pretax Income 306 10 Income Tax 11 Net Income For problems in this section, you should download the KMS spreadsheets available on the book's Web site. 12. Assume that KMS's market share will increase by 0.25% per year rather than the 1% used in the chapter (see Table 18.5) and that its prices remain as in the chapter. What production capacity will KMS require each year? When will an expansion become necessary (that is, when will production volume exceed 1100)? 13. Under the assumption that KMS's market share will increase by 0.25% per year, you determine that the plant will require an expansion in 2015. The expansion will cost $20 million. Assuming that the financing of the expansion will be delayed accordingly, calculate the projected interest payments and the amount of the projected interest tax shields (assuming that KMS still uses a 10-year bond and interest rates remain dde ine that the plant will rquire an expansion in,2015 The esnd the same as in the chapter) through 2018 14. Under the assumption that KS's marketshare will increase by 0.25% per year (and the investment and financing will be adjusted as described in Problem 13), you project the following depreciation: Year 2013 2014 2015 2016 2017 2018 Depreciation 5,492 5,443 7,398 7,4597,513 7,561 Using this information, project net income through 2018 (that is, reproduce Table 18.8 under the new assumptions) TABLE 18.5 KMS's Forecasted Production Capacity Requirements 1 Year 20132014 2015 2016 2017 2018 2 Production Volume (000s units) 3 Market Size 0,000 10,500 11,025 11,576 12,155 12,763 10.0% 11.0% 12.0% 13.0% 14.0% 15.0% Market Share Production Volume (Line 3 Additional Market Information 5 Line 4)| 1,000 1.155 . 1.323| 1,505| 1,702 1,914 7 Average Sales Price S 74.89 S 76.51 $ 78.04 $ 79.60 $ 81.19 82.82 TABLE 18.8 Pro Forma Income Statement for KMS Expansion 1 Year 2 Income Statement ($000s 3 Sales 4 Costs Except Depreciation 5 EBITDA 2013 2014 2015 2016 2017 2018 74,889 88,369 103,247 119,793 138,167 158,546 58,413- 68,928-80,533-93.438-107,770-123,666 6,47619,441 22,714 26.354 30,397 34,880 5,492-7,443-7,498-7,5497,594-7,634 0,984 11,998 15,216 18,806 22,803 27,246 306-1,666-1,666-1.666-1,666 0,678 11,692 13,550 17,140 21,137 25,580 3,737-4,092-4,7425,999-7.398-8,953 6,9417,600 8,807 11,141 13.739 16,627 Depreciation 7 EBIT Interest Expense (net) 9 Pretax Income 306 10 Income Tax 11 Net Income
Step by Step Solution
There are 3 Steps involved in it

Get step-by-step solutions from verified subject matter experts