

Question: how do you compute A state-by-state survey found that the proportions of adults who are smokers in state A and state B were 18.3% and
how do you compute
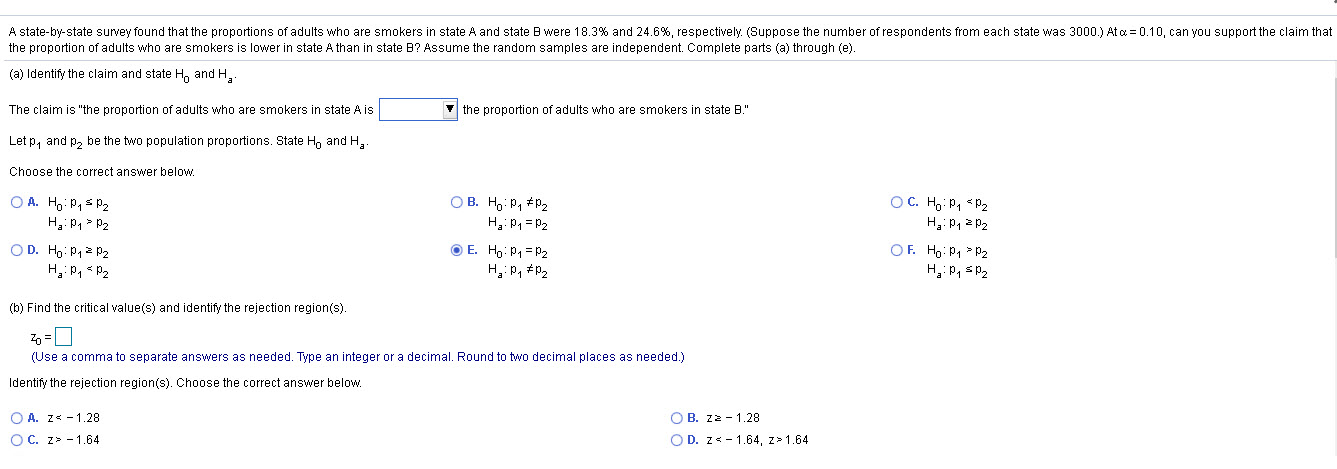
A state-by-state survey found that the proportions of adults who are smokers in state A and state B were 18.3% and 24.6%, respectively. (Suppose the number of respondents from each state was 3000.) At &= 0.10, can you support the claim that the proportion of adults who are smokers is lower in state A than in state B? Assume the random samples are independent. Complete parts (a) through (e). (a) Identify the claim and state H, and Ha. The claim is "the proportion of adults who are smokers in state A is the proportion of adults who are smokers in state B." Let p, and pa be the two population proportions. State Ho and He. Choose the correct answer below. OA. Ho : P,SP2 OB. HO : PA # P2 OC. Ho: P1 = P2 Ha : P1 = P2 Ha : P1 = P2 Ha : P1 2 P2 OD. Ho: P1 = P2 OE. Ho: P1 = P2 OF. Ho: P1 > P2 H, : P1 = P2 Ha: P1 # P2 He: P1 = P2 (b) Find the critical value (s) and identify the rejection region(s). (Use a comma to separate answers as needed. Type an integer or a decimal. Round to two decimal places as needed.) Identify the rejection region(S). Choose the correct answer below. O A. Z - 1.64 OD. Z 1.64
Step by Step Solution
There are 3 Steps involved in it

Get step-by-step solutions from verified subject matter experts