

Question: How do you compute A survey was conducted two years ago asking college students their top motivations for using a credit card. You think this
How do you compute
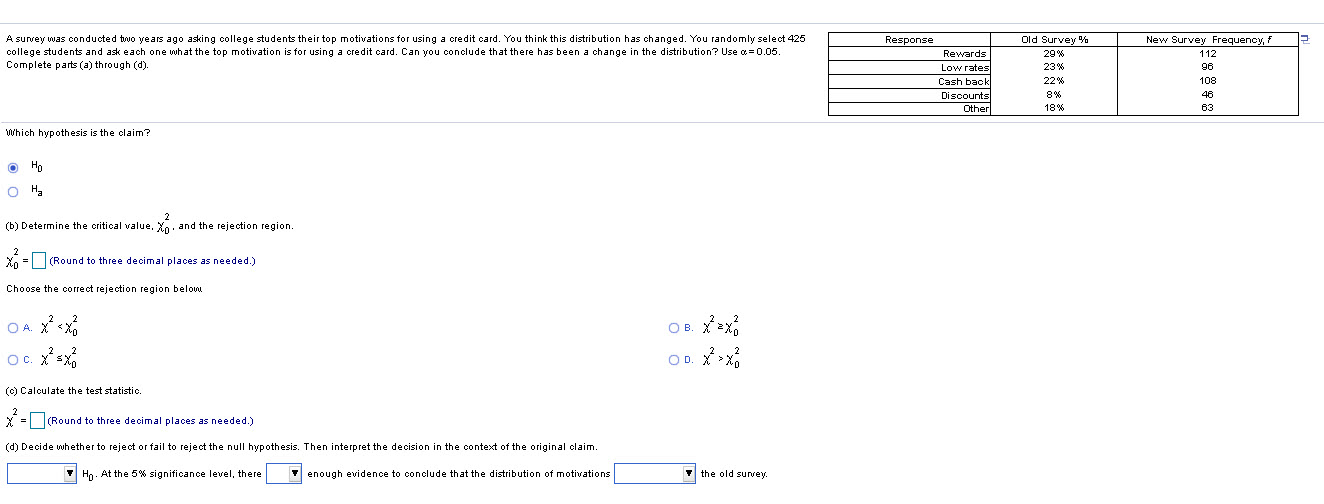
A survey was conducted two years ago asking college students their top motivations for using a credit card. You think this distribution has changed. You randomly select 425 Response Old Survey % New Survey Frequency, f college students and ask each one what the top motivation is for using a credit card. Can you conclude that there has been a change in the distribution? Use @=0.05. Rewards 29% 1 12 Complete parts (a) through (d). Low rates 23% 96 Cash back 22% 108 Discounts 8% 46 Other 18% 63 Which hypothesis is the claim? O O (b) Determine the critical value. X . and the rejection region. 2 Xo =(Round to three decimal places as needed.) Choose the correct rejection region below OA. X XO OB. X EX Oc. X X0 (@) Calculate the test statistic. * = (Round to three decimal places as needed.) (d) Decide whether to reject or fail to reject the null hypothesis. Then interpret the decision in the context of the original claim. Hp . At the 5% significance level, there enough evidence to conclude that the distribution of motivations the old survey
Step by Step Solution
There are 3 Steps involved in it

Get step-by-step solutions from verified subject matter experts