

Question: How do you create a table that contains the average age of workers broken down by union and sector? A row of the table should
How do you create a table that contains the average age of workers broken down by union and sector? A row of the table should be the average age for each sector of a particular union status. So, different union statuses should be rows, and different sectors should be columns.
Assuming you were going to select five rows from CPS85 at random, what is the probability that at least one of the rows would be a woman? Solve this problem using the rules of probability. Make sure the code for your solution would work if I gave you a new table with more rows added (of course, giving you new rows would also change the answer).
Assuming you were going to select five rows from CPS85 at random, what is the probability that at least one of the rows would be a woman? Solve this problem using simulation. Use 1000 "rounds of simulation"
How do you create a new table called CPS85_new, similar to the original CPS85, except where the values for the union variable are not_in_union and in_union.
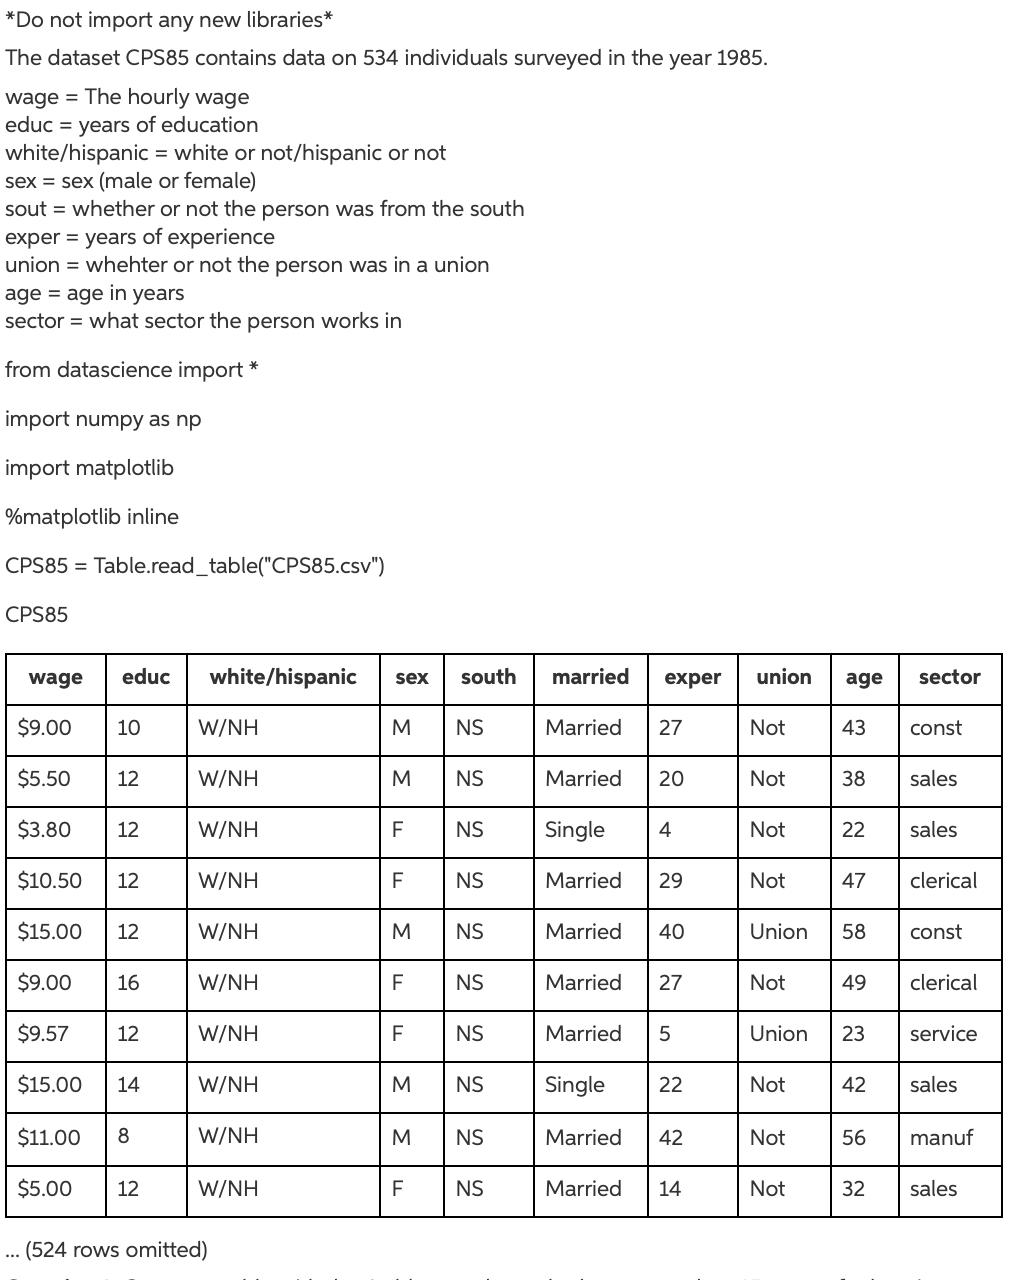
*Do not import any new libraries* The dataset CPS85 contains data on 534 individuals surveyed in the year 1985. wage = The hourly wage educ = years of education white/hispanic = white or not/hispanic or not sex = sex (male or female) sout = whether or not the person was from the south exper = years of experience union = whehter or not the person was in a union age = age in years sector = what sector the person works in from datascience import * import numpy as np import matplotlib %matplotlib inline CPS85 Table.read_table("CPS85.csv") CPS85 wage educ $9.00 10 $5.50 12 $3.80 12 $10.50 12 $15.00 12 $9.00 16 $9.57 12 $15.00 14 $11.00 8 ... $5.00 12 white/hispanic W/NH W/NH W/NH W/NH W/NH W/NH W/NH W/NH W/NH W/NH (524 rows omitted) sex south M NS M F F M F F 2 2 2 2 2 M NS 222 22 F M NS NS married Married 27 Married 20 Single 4 Married 29 exper Married 40 Married Single Married 5 Married Married 27 22 42 14 union age Not Not Not Not Not Not 43 Union 58 Not 38 Not 22 47 Union 23 49 42 56 32 sector const sales sales clerical const clerical service sales manuf sales
Step by Step Solution
3.37 Rating (163 Votes )
There are 3 Steps involved in it
1 Create a table with average age by union and sector Calculate the average age by union and sector averageagetable CPS85groupunion sector npmean Rename the columns for clarity averageagetable average... View full answer

Get step-by-step solutions from verified subject matter experts