

Question: How do you do longhand using Constructing a Scatter Plot and Determining Correlation In Exercises 23-28, (a) display the data in a scatter plot, (b)


How do you do longhand using
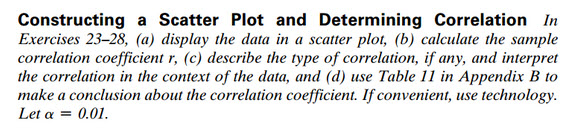

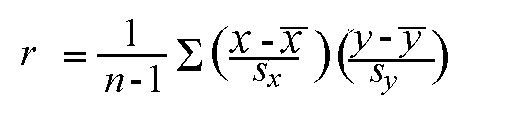
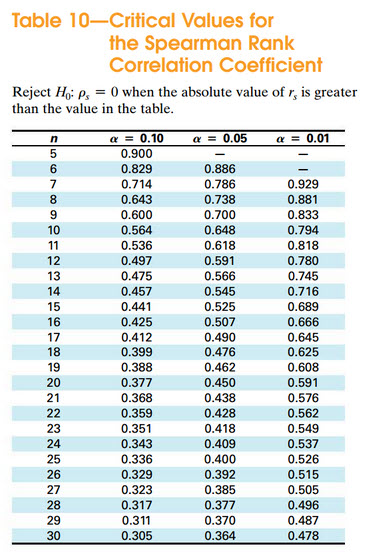
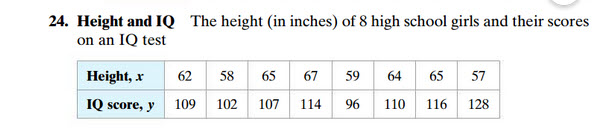
Constructing a Scatter Plot and Determining Correlation In Exercises 23-28, (a) display the data in a scatter plot, (b) calculate the sample correlation coefficient r, (c) describe the type of correlation, if any, and interpret the correlation in the context of the data, and (d) use Table 11 in Appendix B to make a conclusion about the correlation coefficient. If convenient, use technology. Let a = 0.01.1'4. Height and [Q The: height [in inches) of 3 high school girls and their scores on an IQ test am: \"In a 5? MM! 102 III}? -a 11B 128 \fTable IllCritical Values for the Speermen Rank Correlation Coefficient Reject H\": p, = H when the absolute value at r, is greater than the 1value in the table. :1 er = H.1H a: = H.95 a = H.H'I 5 H.955 - 5 H.529 H.555 in" H.214 H.255 H.929 5 H.543 H.235 H.1 9 H.555 H.255 H.533 1H H.554 H.545 H.194 11 H.535 H.515 5.515 12 H.491r H.591 H.155 13 5.4?5 5.555 5.?45 14 H.451r H.545 H.215 15 H.441 5.525 5.- 15 H.425 H.5H? H.555 1? H.412 H.49H H.545 15 H.399 H.415 H.525 19 H.355 H.452 H.559 2H H.322? H.455 H.591 21 H.555 H.435 H.525 22 H.359 H.425 H.552 23 H.351 5.415 5.549 24 H.343 H.459 H.537!r 25 H.335 H.4HH H.525 25 H.329 H.392 H.515 2? H.323 H.355 H.555 25 H.313I H.333I H.495 29 H.311 H.325 Hail-52'r EH H.395 H.354 H.415
Step by Step Solution
There are 3 Steps involved in it

Get step-by-step solutions from verified subject matter experts