

Question: How do you explain the differences in this table based on univariate and multivariable logistic regression? what are the key results? Table 2. Association between
How do you explain the differences in this table based on univariate and multivariable logistic regression?
what are the key results?
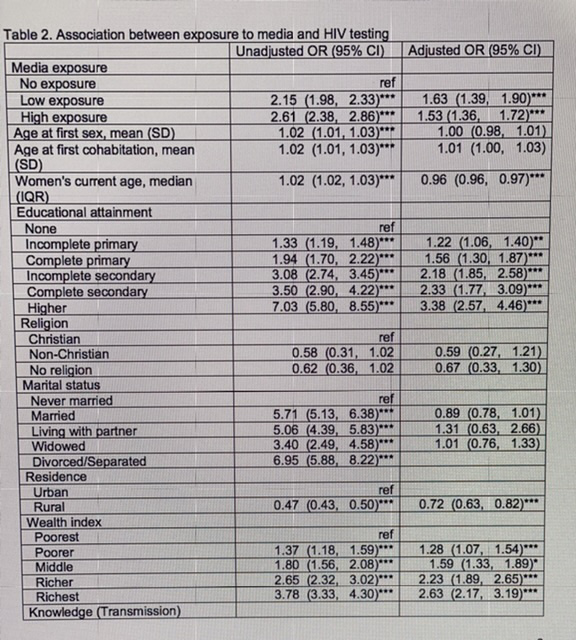
Table 2. Association between exposure to media and HIV testing Unadjusted OR (95% CI) Adjusted OR (95% CI) Media exposure No exposure ref Low exposure 2.15 (1.98, 2.33)"* 1.63 (1.39, 1.90)" High exposure 2.61 (2.38, 2.86)"* 1.53 (1.36, 1.72)"" Age at first sex, mean (SD) 1.02 (1.01, 1.03)" 1.00 (0.98, 1.01) Age at first cohabitation, mean 1.02 (1.01, 1.03)"" 1.01 (1.00, 1.03) (SD Women's current age, median 1.02 (1.02, 1.03)"- 0.96 (0.96, 0.97)"" (IQR) Educational attainment None ref Incomplete primary 1.33 (1.19, 1.48)" 1.22 (1.06, 1.40)"" Complete primary 1.94 (1.70, 2.22)"" 1.56 (1.30, 1.87)"" Incomplete secondary 3.08 (2.74, 3.45)"" 2.18 (1.85, 2.58)" Complete secondary 3.50 (2.90, 4.22)""* 2.33 (1.77, 3.09)" Higher 7.03 (5.80, 8.55)*"* 3.38 (2.57, 4.46)"" Religion Christian ref Non-Christian 0.58 (0.31, 1.02 0.59 (0.27, 1.21) No religion 0.62 (0.36, 1.02 0.67 (0.33, 1.30) Marital status Never married ref Married 5.71 (5.13, 6.38)" 0.89 (0.78, 1.01) Living with partner 5.06 (4.39, 5.83)." 1.31 (0.63, 2.66) Widowed 3.40 (2.49, 4.58)."* 1.01 (0.76, 1.33) Divorced/Separated 6.95 (5.88, 8.22)" Residence Urban ref Rural 0.47 (0.43, 0.50)" 0.72 (0.63, 0.82)" Wealth index Poorest ref Poorer 1.37 (1.18, 1.59)"" 1.28 (1.07, 1.54)""* Middle 1.80 (1.56, 2.08)" 1.59 (1.33, 1.89)" Richer 2.65 (2.32, 3.02)""" 2.23 (1.89, 2.65)"" Richest 3.78 (3.33, 4.30)""' 2.63 (2.17, 3.19)""* Knowledge (Transmission)
Step by Step Solution
There are 3 Steps involved in it

Get step-by-step solutions from verified subject matter experts