

Question: How do you explain the variability in the values? a) Section Data for Water Weights Graduated Cylinder Pipetting Mean 7.85 Mean 7.77 Median 7.85 Median
How do you explain the variability in the values?
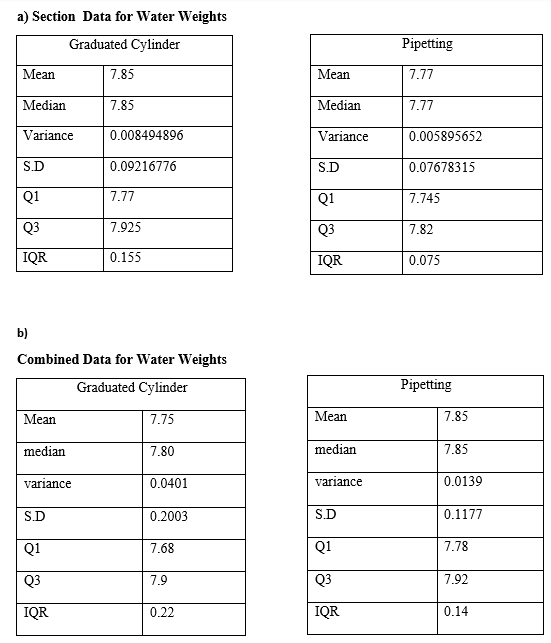
a) Section Data for Water Weights Graduated Cylinder Pipetting Mean 7.85 Mean 7.77 Median 7.85 Median 7.77 Variance 0.008494896 Variance 0.005895652 S.D 0.09216776 S.D 0.07678315 01 7.77 Q1 7.745 03 7.925 03 7.82 IQR 0.155 IQR 0.075 b) Combined Data for Water Weights Graduated Cylinder Pipetting Mean 7.75 Mean 7.85 median 7.80 median 7.85 variance 0.0401 variance 0.0139 S.D 0.2003 S.D 0.1177 Q1 7.68 Q1 7.78 Q3 7.9 03 7.92 IQR 0.22 IOR 0.14
Step by Step Solution
There are 3 Steps involved in it
1 Expert Approved Answer
Step: 1 Unlock

Question Has Been Solved by an Expert!
Get step-by-step solutions from verified subject matter experts
Step: 2 Unlock
Step: 3 Unlock