

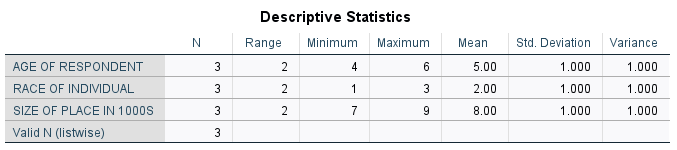
Question: HOW DO YOU INTERPRET THIS DATA Descriptive Statistics N Range Minimum Maximum Mean Std. Deviation Variance AGE OF RESPONDENT 4 6 5.00 1.000 1.000 RACE
HOW DO YOU INTERPRET THIS DATA

Descriptive Statistics N Range Minimum Maximum Mean Std. Deviation Variance AGE OF RESPONDENT 4 6 5.00 1.000 1.000 RACE OF INDIVIDUAL 3 2.00 1.000 1.000 SIZE OF PLACE IN 1000S 3 2 7 9 8.00 1.000 1.000 Valid N (listwise)
Step by Step Solution
There are 3 Steps involved in it
1 Expert Approved Answer
Step: 1 Unlock

Question Has Been Solved by an Expert!
Get step-by-step solutions from verified subject matter experts
Step: 2 Unlock
Step: 3 Unlock