

Question: How do you interpret this data ? Financial Comfort Comfortable Count 7 5 32 79 93 216 Expected Count 8.6 8.6 49.1 79.9 69.7 216.0
How do you interpret this data ?
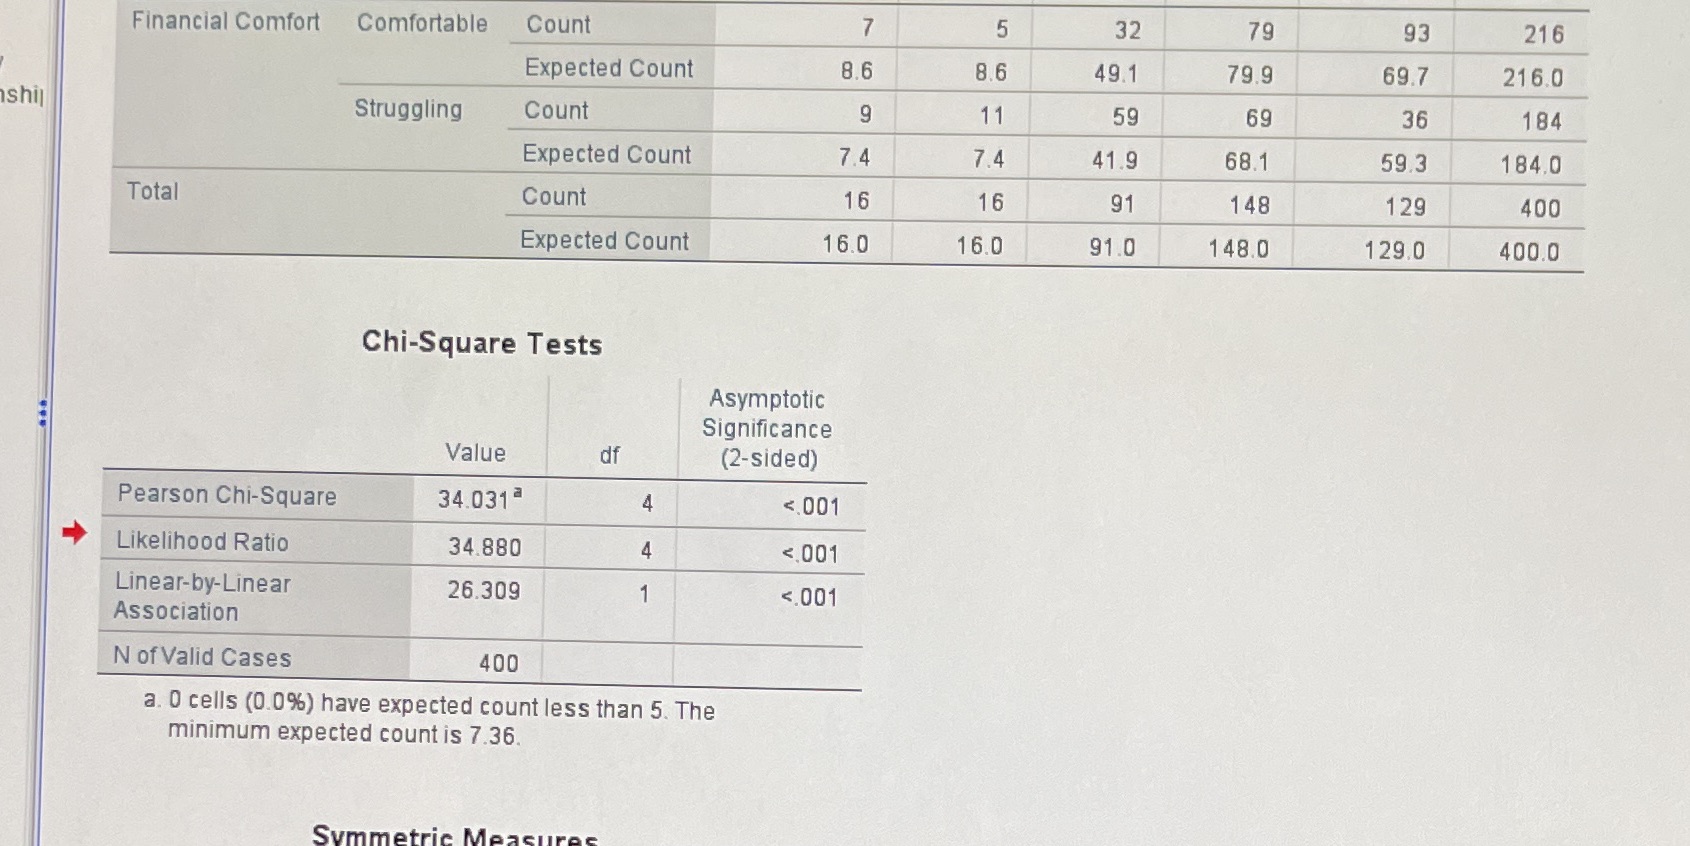
Financial Comfort Comfortable Count 7 5 32 79 93 216 Expected Count 8.6 8.6 49.1 79.9 69.7 216.0 shij Struggling Count 9 11 59 69 36 184 Expected Count 7.4 7.4 41.9 68.1 59 3 184.0 Total Count 16 16 91 148 129 400 Expected Count 16.0 16.0 91.0 148.0 129.0 400.0 Chi-Square Tests Asymptotic Significance Value df (2-sided) Pearson Chi-Square 34.031 4 <.001 likelihood ratio linear-by-linear association n of valid cases a. cells have expected count less than the minimum is symmetric mea>
Step by Step Solution
There are 3 Steps involved in it
1 Expert Approved Answer
Step: 1 Unlock

Question Has Been Solved by an Expert!
Get step-by-step solutions from verified subject matter experts
Step: 2 Unlock
Step: 3 Unlock