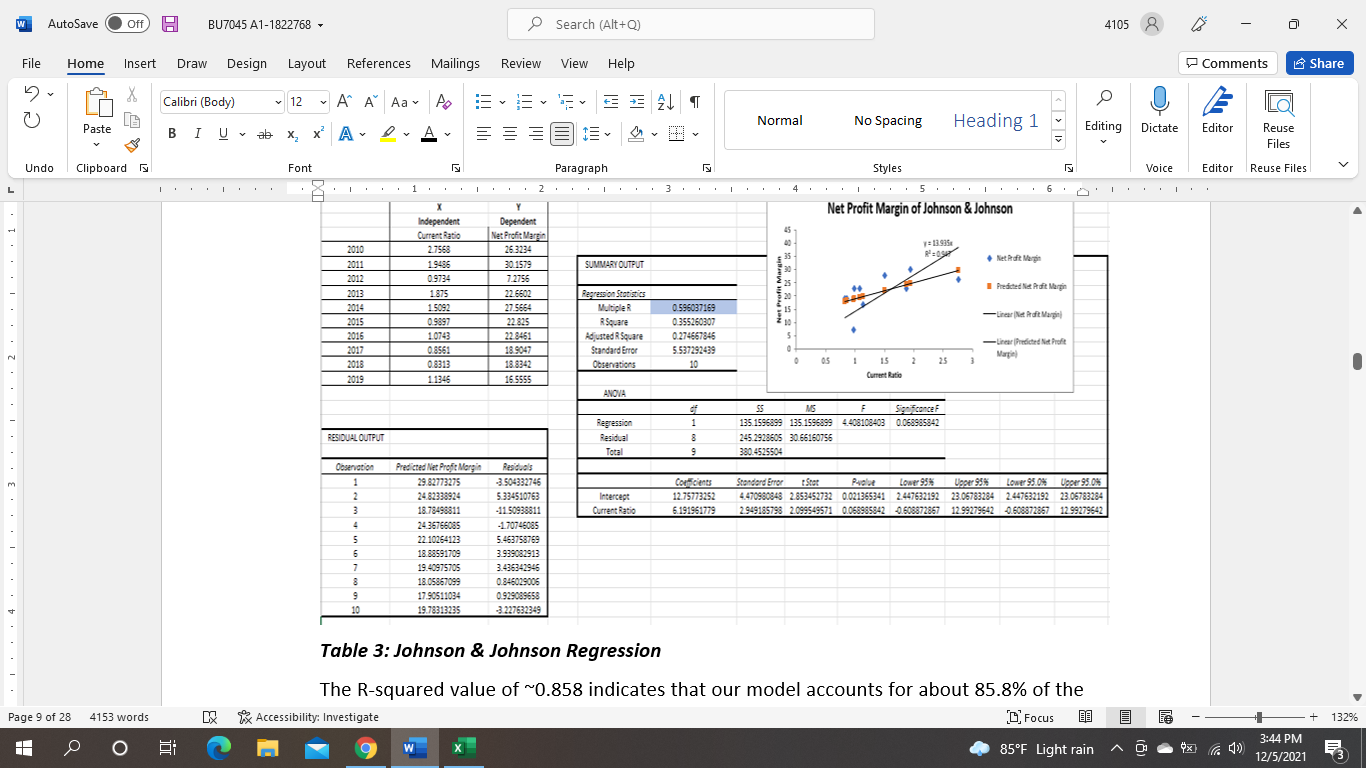
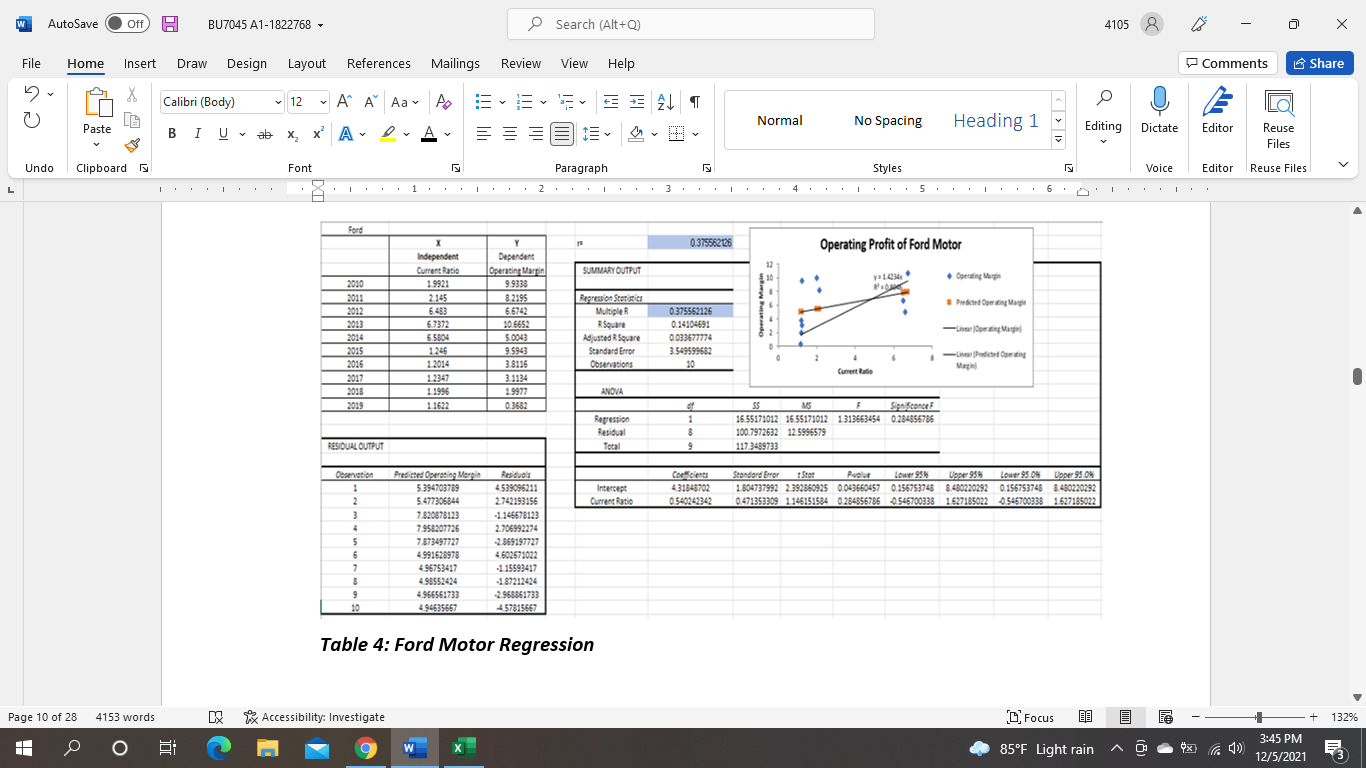
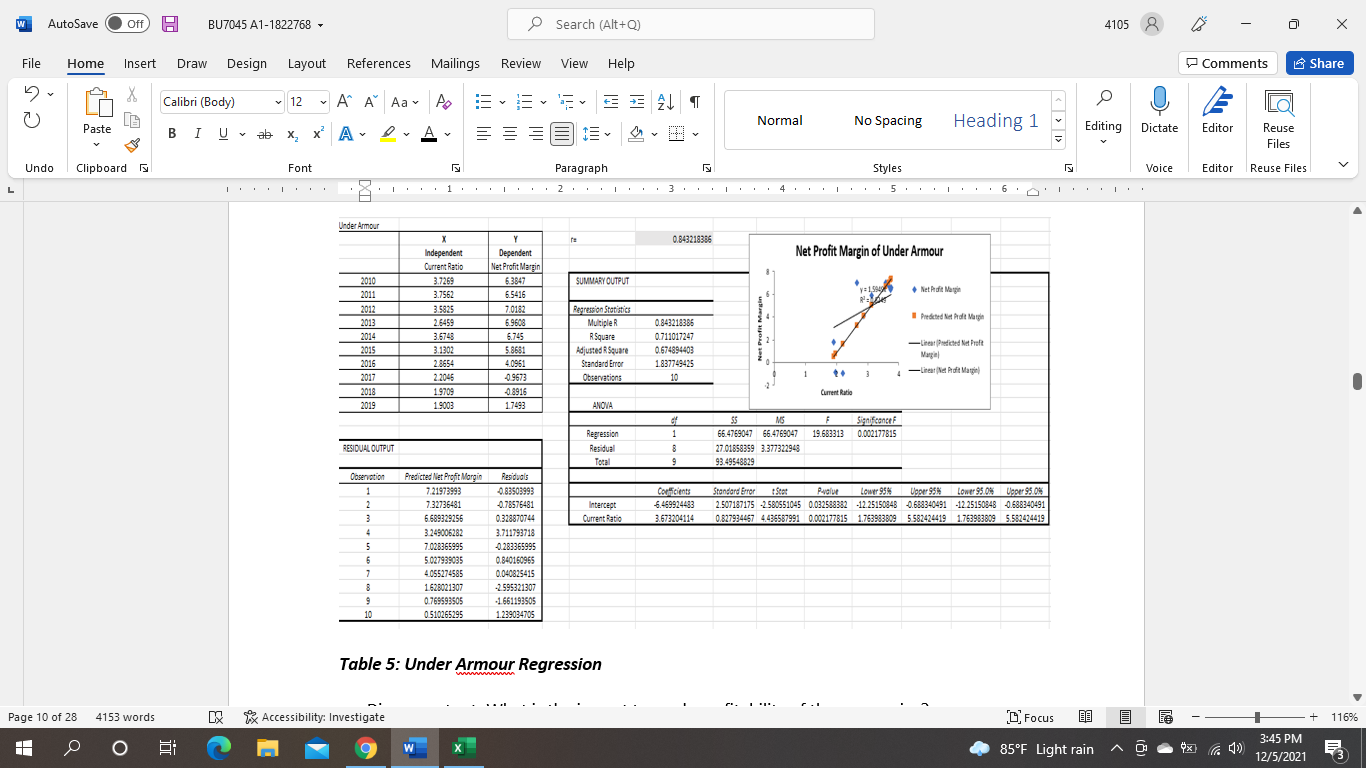
Question: How do you interpret this data regression of Johnson & Johnson's company, Under Armour and Ford Motor respectively. Explain in details on the findings. W

How do you interpret this data regression of Johnson & Johnson's company, Under Armour and Ford Motor respectively. Explain in details on the findings.

How do you interpret this data regression ofHow do you interpret this data regression ofHow do you interpret this data regression of
W AutoSave Off BU7045 A1-1822768 - Search (Alt+Q) 4105 X File Home Insert Draw Design Layout References Mailings Review View Help Comments Share G Calibri (Body) 12 ~ A" A" Aa A Normal Paste No Spacing X X' A LA. Heading 1 BIUab Editing Dictate Editor Reuse Files Undo Clipboard Font Paragraph Styles Voice Editor Reuse Files 1 2 3 1 . 5 . 1 Net Profit Margin of Johnson & Johnson Independent Dependent Current Ratio Net Profit Margin : 13.935 2010 2.7568 26 323 35 2011 1 948 30.1579 SUMMARY OUTPUT Net Profit Margin 2012 0.9734 7.2756 Net Profit Margin I Predicted Net Profit Margin 2013 1 875 12. 660 ion Statistics 20 2014 1 5092 27.5664 Multiple 0.59 6037183 15 2015 -Linear Net Profit Margin) 0.9897 22 825 R Square 0.355260307 2016 1.0743 22 846 Adjusted R Square 0.274667846 -Linger Prodded Net Profit 2017 0.8561 8 9047 Standard Error 5.537292439 2018 0.8313 18.8342 Observations 10 05 1 15 2 25 2019 1.1346 16 9595 Current Ratio ANOVA SS MS Significance F egression 135 1596899 135 1596899 4.408108403 0.068985842 SIDUAL OUTPUT Residual 245.2928605 30.66160756 Total 380.4525504 Observation Predicted Net Profit Margin Residual's 29.82773275 3 504332746 Contaclients Standard Error Lower 95% Upper 95% Lower 95.095 Upper 95.0% 24.82338924 5 334510763 Intercept 12.75773252 4.470980848 2.853452732 0.021365341 2.447632192 2 23.06783284 2 447632192 23.06783284 18 78498811 -11 50938811 Current Ratio 6.191961779 2949185798 2.099549571 0.068985842 -0.603872867 12 99279642 -0.608872867 12 99279642 24.36766085 -1.70746085 22 10264123 5.463758769 18 88591709 3.9390829 19.40875705 3.4363429- 18 0586709 0.8460290 17.90511034 0.929089658 19.78313235 Table 3: Johnson & Johnson Regression The R-squared value of ~0.858 indicates that our model accounts for about 85.8% of the Page 9 of 28 4153 words 1% Accessibility: Investigate Focus + 132% O O W 3:44 PM 85 F Light rain ~C 12/5/2021 3W AutoSave Off BU7045 A1-1822768 - Search (Alt+Q) 4105 X File Home Insert Draw Design Layout References Mailings Review View Help Comments Share G Calibri (Body) 12 ~ A" A" Aa* Ap O Normal Paste No Spacing X X' A LA . Heading 1 BIUab Editing Dictate Editor Reuse Files Undo Clipboard Is Font Paragraph Styles Voice Editor Reuse Files I . . . 1 2 3 5 6 0 Ford 0.379562126 Operating Profit of Ford Motor Independent Dependent Current Ratio Operating Margin SUMMARY OUTPUT 12 Operating Margin 2010 1 9921 9.9338 2011 2 145 8.2195 I Parketed Operating Maya 2012 6.483 5.6742 Multiple 0.375562125 2013 6.7372 10.665 R Square 0.14104591 2014 6.5804 5.0043 Adjusted R Square 0.033677774 2015 1 246 95943 Standard Error 3.549599682 2016 1 2014 3.8116 Observations 10 Current Basis Mrtel 2017 1 2347 3.1134 2018 1.1996 1.9977 ANOVA 2019 1 1622 D.3683 Sign Sconce F Regression 16 55171012 16.55171012 1313563454 0.284656786 Residual 100.7972632 12 5996579 RESIDUAL OUTPUT Total 117.3459733 Observation Predicted Operating Margin Standard Error Lower 95% Lower 95.0% Upper 95.0% 5.394703789 .539096211 Intercept .3184870 1 804737992 2 392860925 0.043650457 0.156753748 8.480220292 0.156753748 8.450220792 5.477306844 2.742193156 Current Ratio 0.540242342 0.471353309 1.145151584 0.284856785 -0.545700338 1627185022 0 545700338 1 627185022 .wNM 7 820878123 -1 146578123 7.958207726 2.706992274 7.873497727 -2 869197727 4 991628978 4.602671022 4.95753417 -1 15593417 4 98552424 -1 87212424 4.966561733 2 968561733 394535657 4 57815657 Table 4: Ford Motor Regression Page 10 of 28 4153 words Accessibility: Investigate [ Focus + 132% O 3:45 PM 85F Light rain ~ 9 ( 1x 7 (() 12/5/2021 3W AutoSave Off BU7045 A1-1822768 - Search (Alt+Q) 4105 X File Home Insert Draw Design Layout References Mailings Review View Help Comments Share G Calibri (Body) 12 ~ A" A" Aa A O Normal BI U~ x x ADA No Spacing Heading 1 Paste Editing Dictate Editor Reuse Files Undo Clipboard Font Paragraph Styles Voice Editor Reuse Files 1 . 3 Under Armour 0.843218386 Independent Dependent Net Profit Margin of Under Armour Current Ratio Net Profit Margin 2010 3.7269 6.3847 SUMMARY OUTPUT 2011 3.7562 5.5416 * Net Profit Margin 2012 3.5825 7.0182 Regression Statistic 2013 2.6459 5.9608 Multiple R 0.843218385 Predicted Net Profit Margin Profit Margin 2014 3.6748 6.745 R Square 0.711017247 -Licent (Predicted Net Profit 2015 3.1302 5.8681 Adjusted R Square Q.674894403 Margel 2016 2.8654 4.0951 Standard Error 1 837749425 2.2045 -Linent (Net Profit Margin) 2017 0.9673 Observations 10 a J 2018 1.9709 0.8916 Current Ratio 2019 1.9003 7493 ANOVA SS Significance F Regression 66 4769047 66.4769047 19.683313 0.002177815 RESIDUAL OUTPUT Residual 27 01858359 3.377322948 Tocall 93.49548829 Observation Predicted Net Profit Margin 7.21973993 0.83503993 Conficients Standard Error Pwaiur Lower 95% Upper 95% Lower 95 0% Upper 95 0% 7.32736481 -0.76576481 Intercept 6.469924483 2.507187175 -2 580651045 0.032538382 -12.25150848 -0.658340491 -12 25150848 -0.688340491 6.689329256 0.328870744 Current Ratio .673204114 0.827934457 4.43658799 1.436587991 0.002177815 1.763983809 5 582424419 1.753983809 5.582424419 3 249006282 3.711793718 7028365995 -0.283365995 5.027939035 0.840160965 4 055274585 0.040825415 1628021307 -2 595321307 0.769593505 1 661193505 0 510265295 .239034705 Table 5: Under Armour Regression Page 10 of 28 4153 words Accessibility: Investigate Focus + 116% O 3:45 PM 85 F Light rain 12/5/2021

Step by Step Solution

There are 3 Steps involved in it

1 Expert Approved Answer
Step: 1 Unlock blur-text-image
Question Has Been Solved by an Expert!

Get step-by-step solutions from verified subject matter experts

Step: 2 Unlock
Step: 3 Unlock

Students Have Also Explored These Related Accounting Questions!