

Question: How do you interpret this graph? Make sure that your interpretation is based on the actual descriptions of these two variables Frequencies Statistics Work interferes
How do you interpret this graph? Make sure that your interpretation is based on the actual descriptions of these two variables
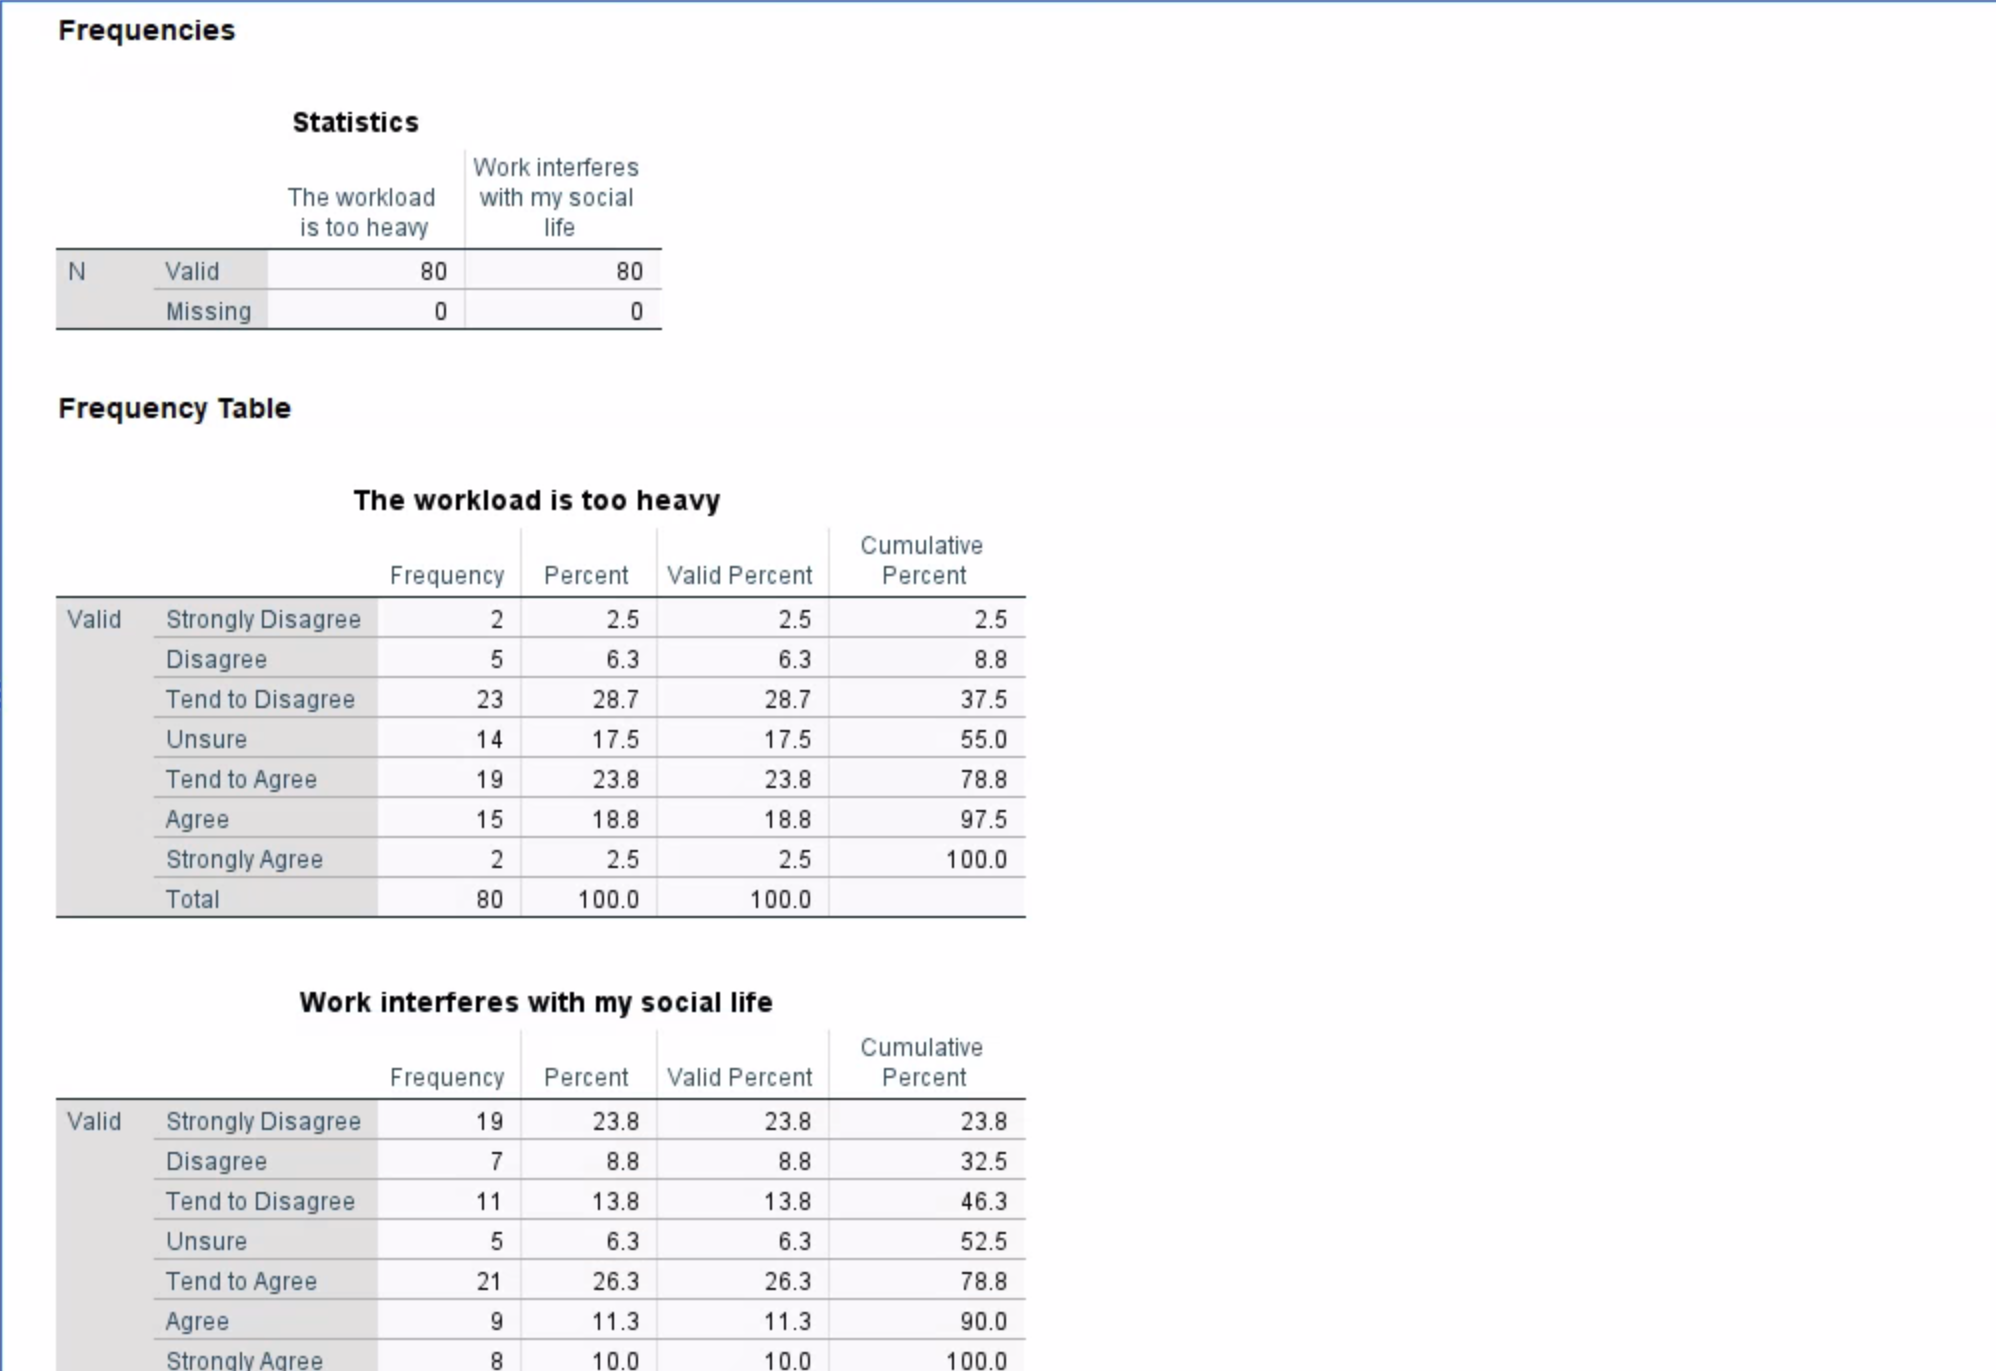
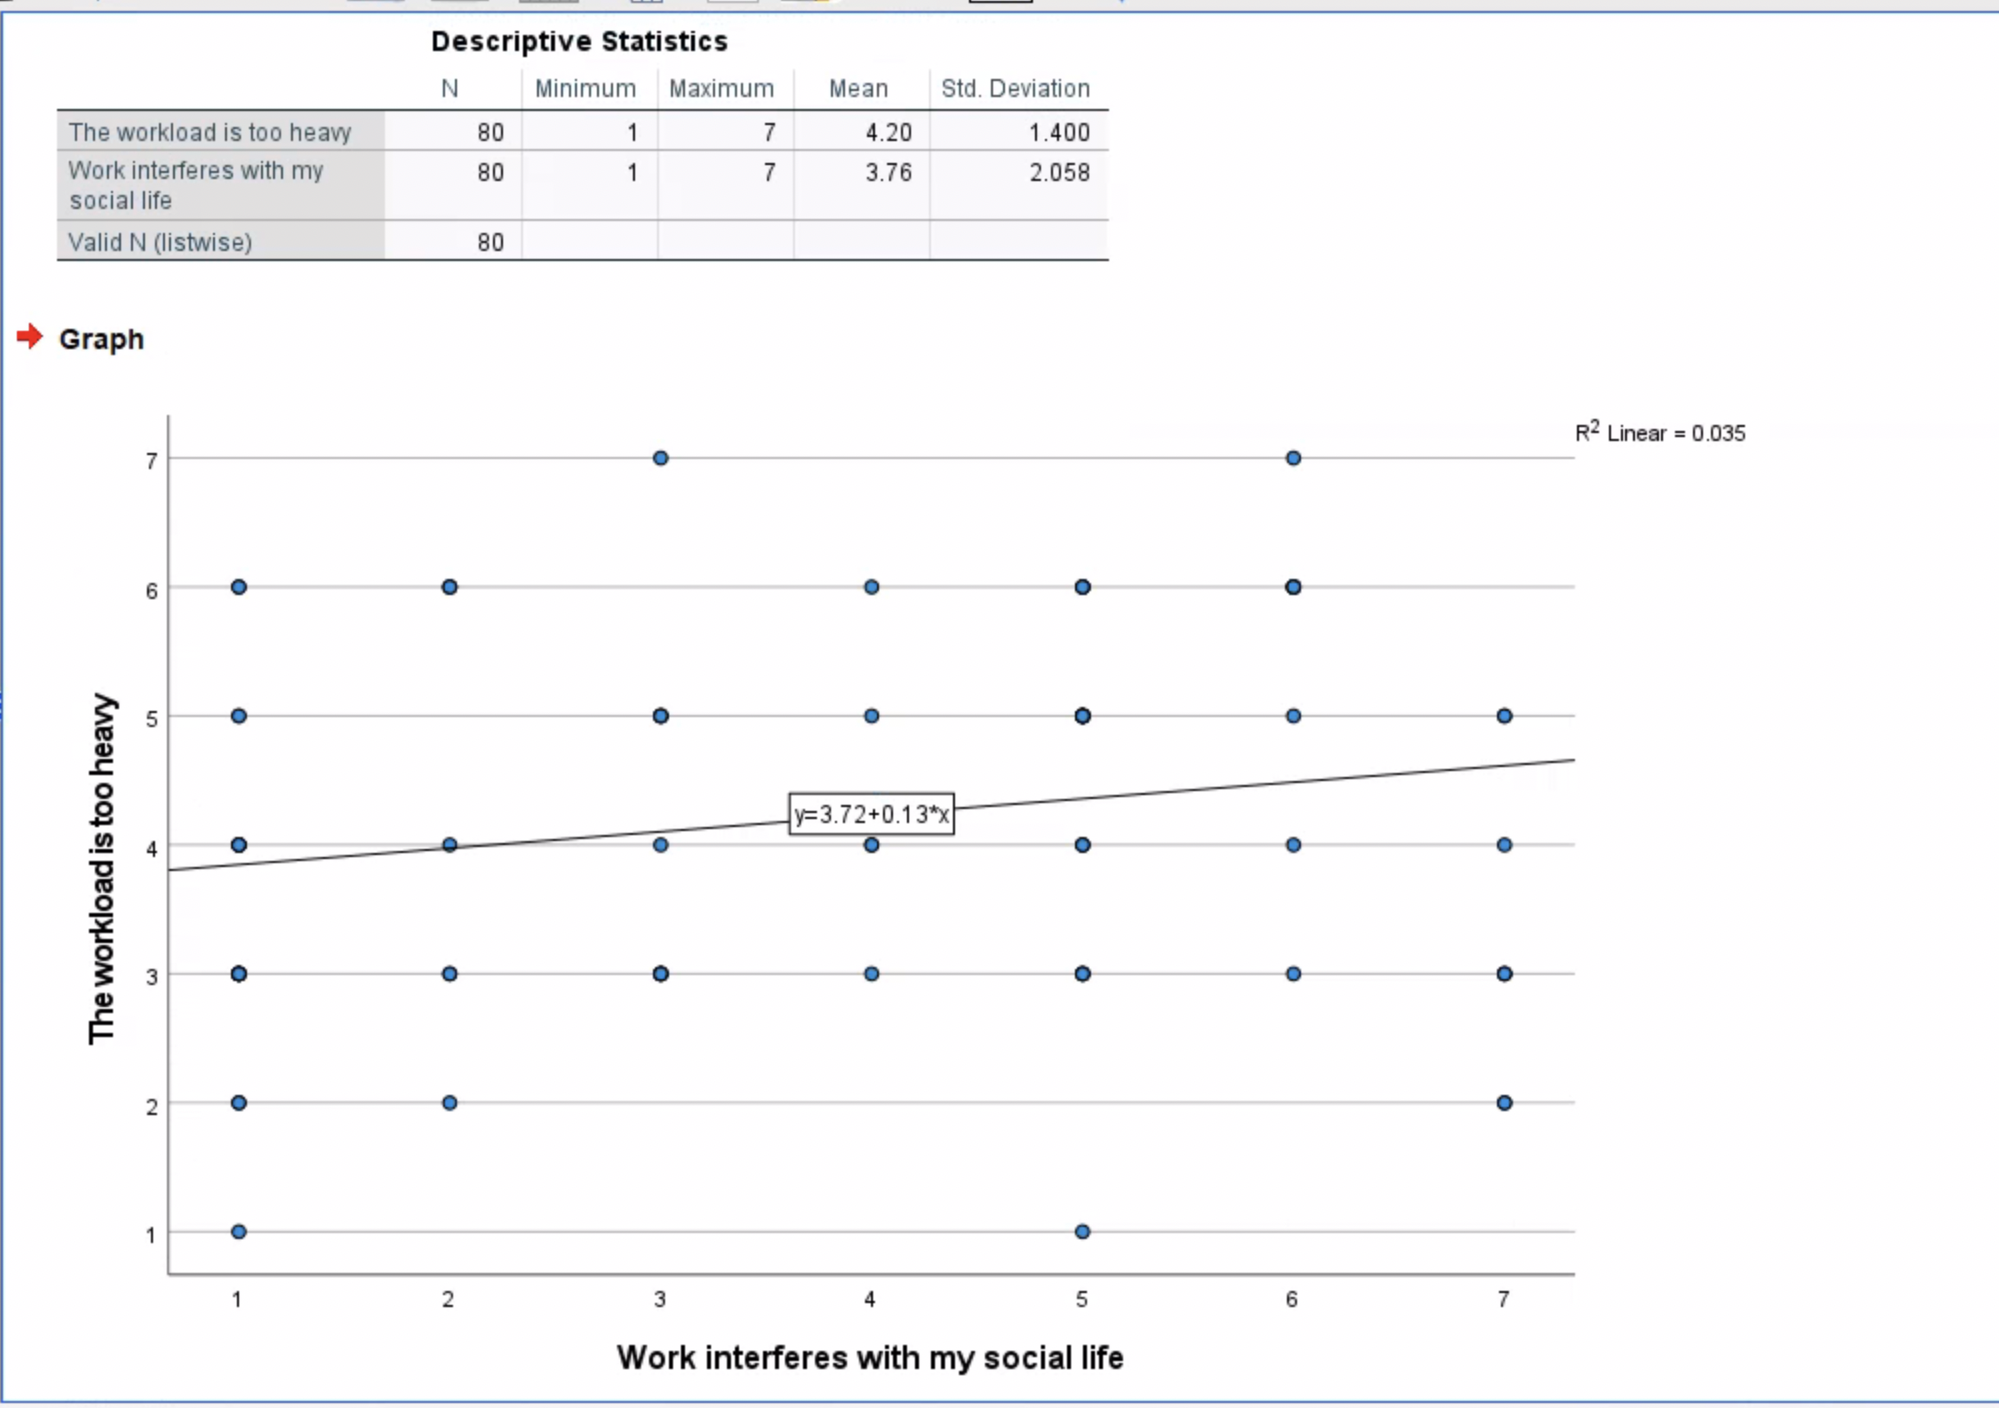
Frequencies Statistics Work interferes The workload with my social is too heavy life N Valid 80 80 Missing 0 0 Frequency Table The workload is too heavy Cumulative Frequency Percent Valid Percent Percent Valid Strongly Disagree 2 2.5 2.5 2.5 Disagree 5 6.3 6.3 8.8 Tend to Disagree 23 28.7 28.7 37.5 Unsure 14 17.5 17.5 55.0 Tend to Agree 19 23.8 23.8 78.8 Agree 15 18.8 18.8 97.5 Strongly Agree 2 2.5 2.5 100.0 Total 80 100.0 100.0 Work interferes with my social life Cumulative Frequency Percent Valid Percent Percent Valid Strongly Disagree 19 23.8 23.8 23.8 Disagree 7 8.8 8.8 32.5 Tend to Disagree 11 13.8 13.8 46.3 Unsure 5 6.3 6.3 52.5 Tend to Agree 21 26.3 26.3 78.8 Agree 9 11.3 11.3 90.0 Strongly Agree 8 10.0 10.0 100.0Descriptive Statistics N Minimum Maximum Mean Std. Deviation The workload is too heavy 80 7 4.20 1.400 Work interferes with my 80 - 7 3.76 2.058 social life Valid N (listwise) 80 Graph R2 Linear = 0.035 V 6 O 5 y=3.72+0.13*X 4 The workload is too heavy 3 2 1 2 3 5 6 7 Work interferes with my social life
Step by Step Solution
There are 3 Steps involved in it

Get step-by-step solutions from verified subject matter experts