

Question: how do you make a chart to display the growth of population over time? it's for a project, and I need help with making a
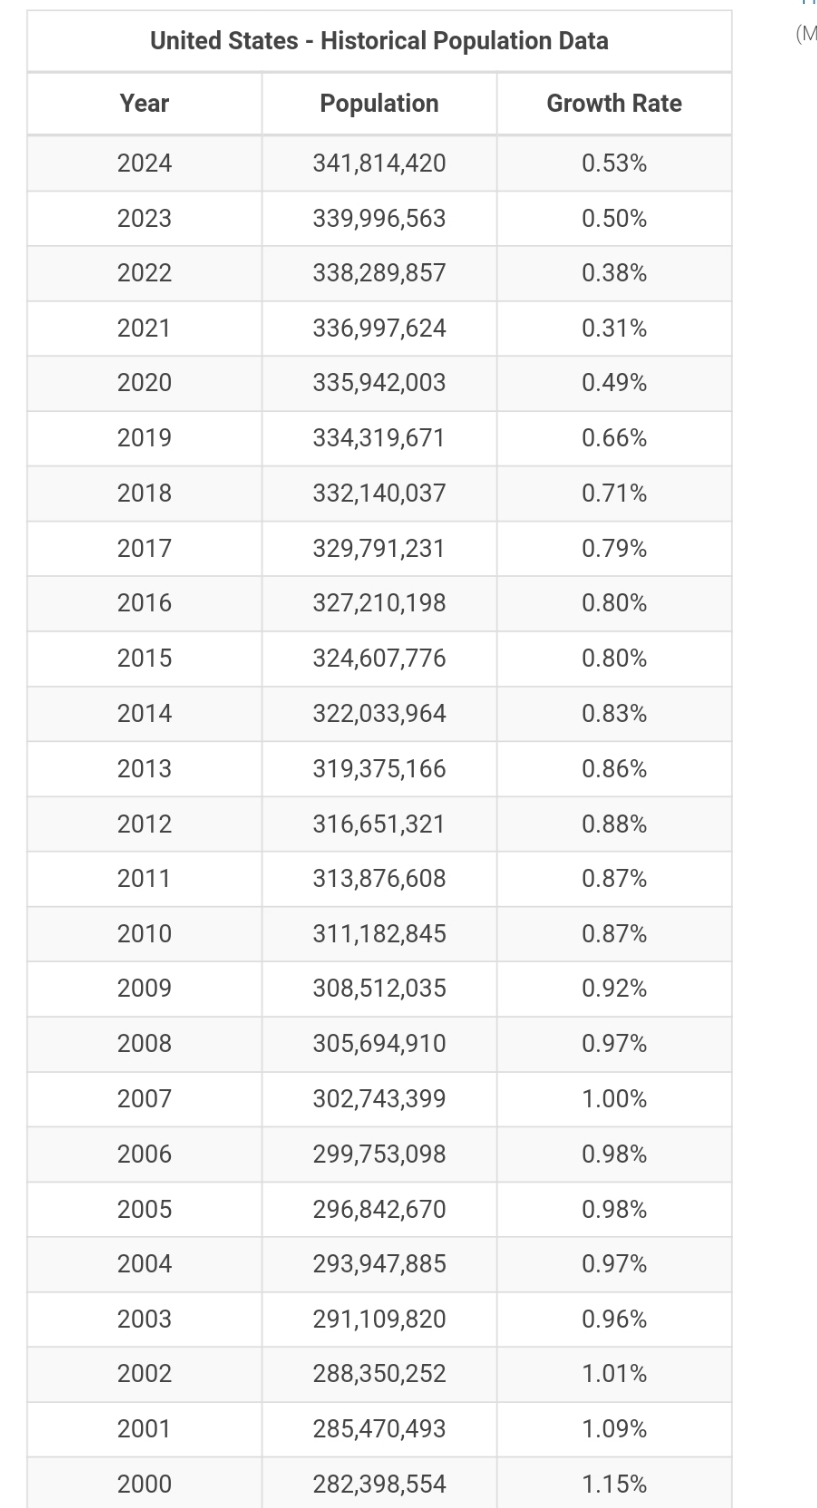
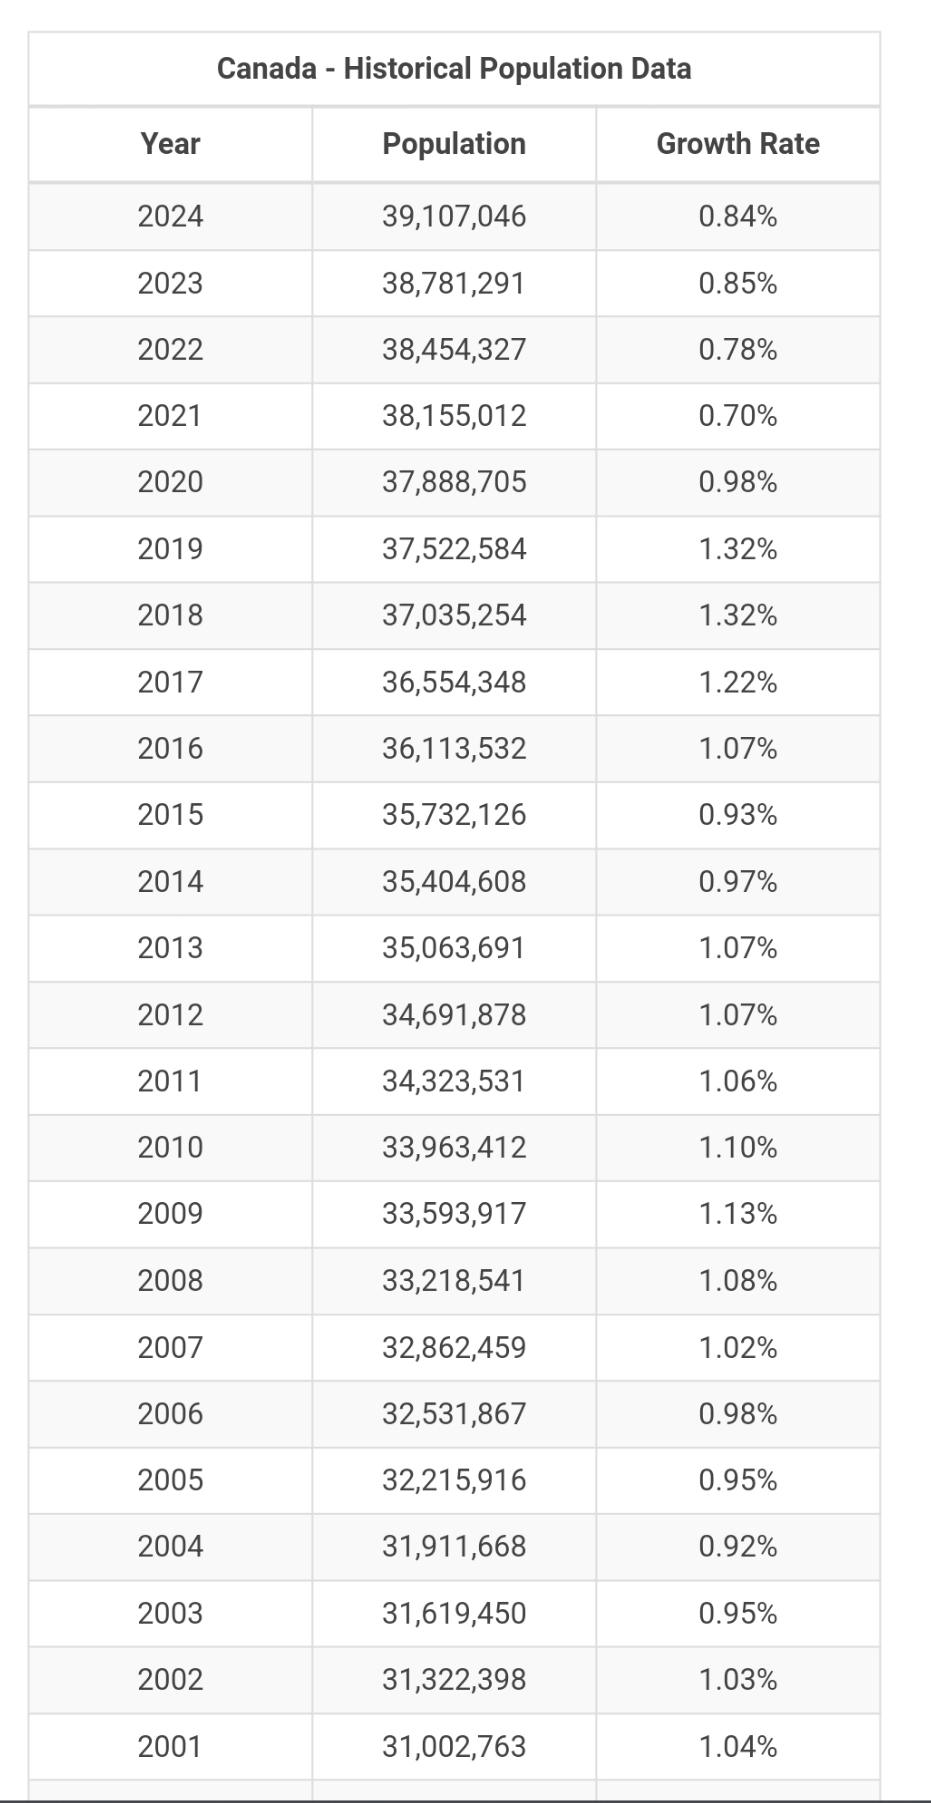
how do you make a chart to display the growth of population over time? it's for a project, and I need help with making a graph that shows the difference in populationin canada vs U.S. the picture below has some data of population in the U.S and Canada my research question is: Can exponential functions accurately model the growth of population in the U.S. vs. Canada within a 5 year span? I also need help with making a regression equation for this, along with the chart thanks!
\f\f
Step by Step Solution
There are 3 Steps involved in it
1 Expert Approved Answer
Step: 1 Unlock

Question Has Been Solved by an Expert!
Get step-by-step solutions from verified subject matter experts
Step: 2 Unlock
Step: 3 Unlock