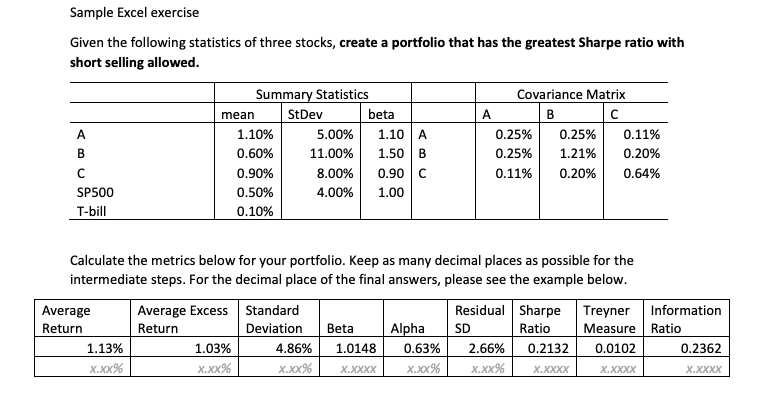
Question: How do you obtain the numbers in the bottom chart using the numbers in the Top chart- With excel Sample Excel exercise Given the following

How do you obtain the numbers in the bottom chart using the numbers in the Top chart- With excel

How do you obtain the numbers in the bottom chart
Sample Excel exercise Given the following statistics of three stocks, create a portfolio that has the greatest Sharpe ratio with short selling allowed. Summary Statistics Covariance Matrix mean StDev beta A B C A 1.10% 5.00% 1.10 A 0.25% 0.25% 0.11% B 0.60% 11.00% 1.50 B 0.25% 1.21% 0.20% C 0.90% 8.00% 0.90 C 0.11% 0.20% 0.64% SP500 0.50% 4.00% 1.00 T-bill 0.10% Calculate the metrics below for your portfolio. Keep as many decimal places as possible for the intermediate steps. For the decimal place of the final answers, please see the example below. Average Average Excess Standard Residual Sharpe Treyner Information Return Return Deviation Beta Alpha SD Ratio Measure Ratio 1.13% 1.03% 4.86% 1.0148 0.63% 2.66% 0.2132 0.0102 0.2362 X.XX X.xx% X.XX% X.XXXX X.xx%% X.xx% X.XXXX X.XXXX X.Xxxx

Step by Step Solution

There are 3 Steps involved in it

1 Expert Approved Answer
Step: 1 Unlock blur-text-image
Question Has Been Solved by an Expert!

Get step-by-step solutions from verified subject matter experts

Step: 2 Unlock
Step: 3 Unlock

Students Have Also Explored These Related Finance Questions!