

Question: How do you obtain the scatterplot and trendline for the data? ( include equation & provide screen shot of analysis) Using the equation from the
How do you obtain the scatterplot and trendline for the data? (include equation & provide screen shot of analysis)
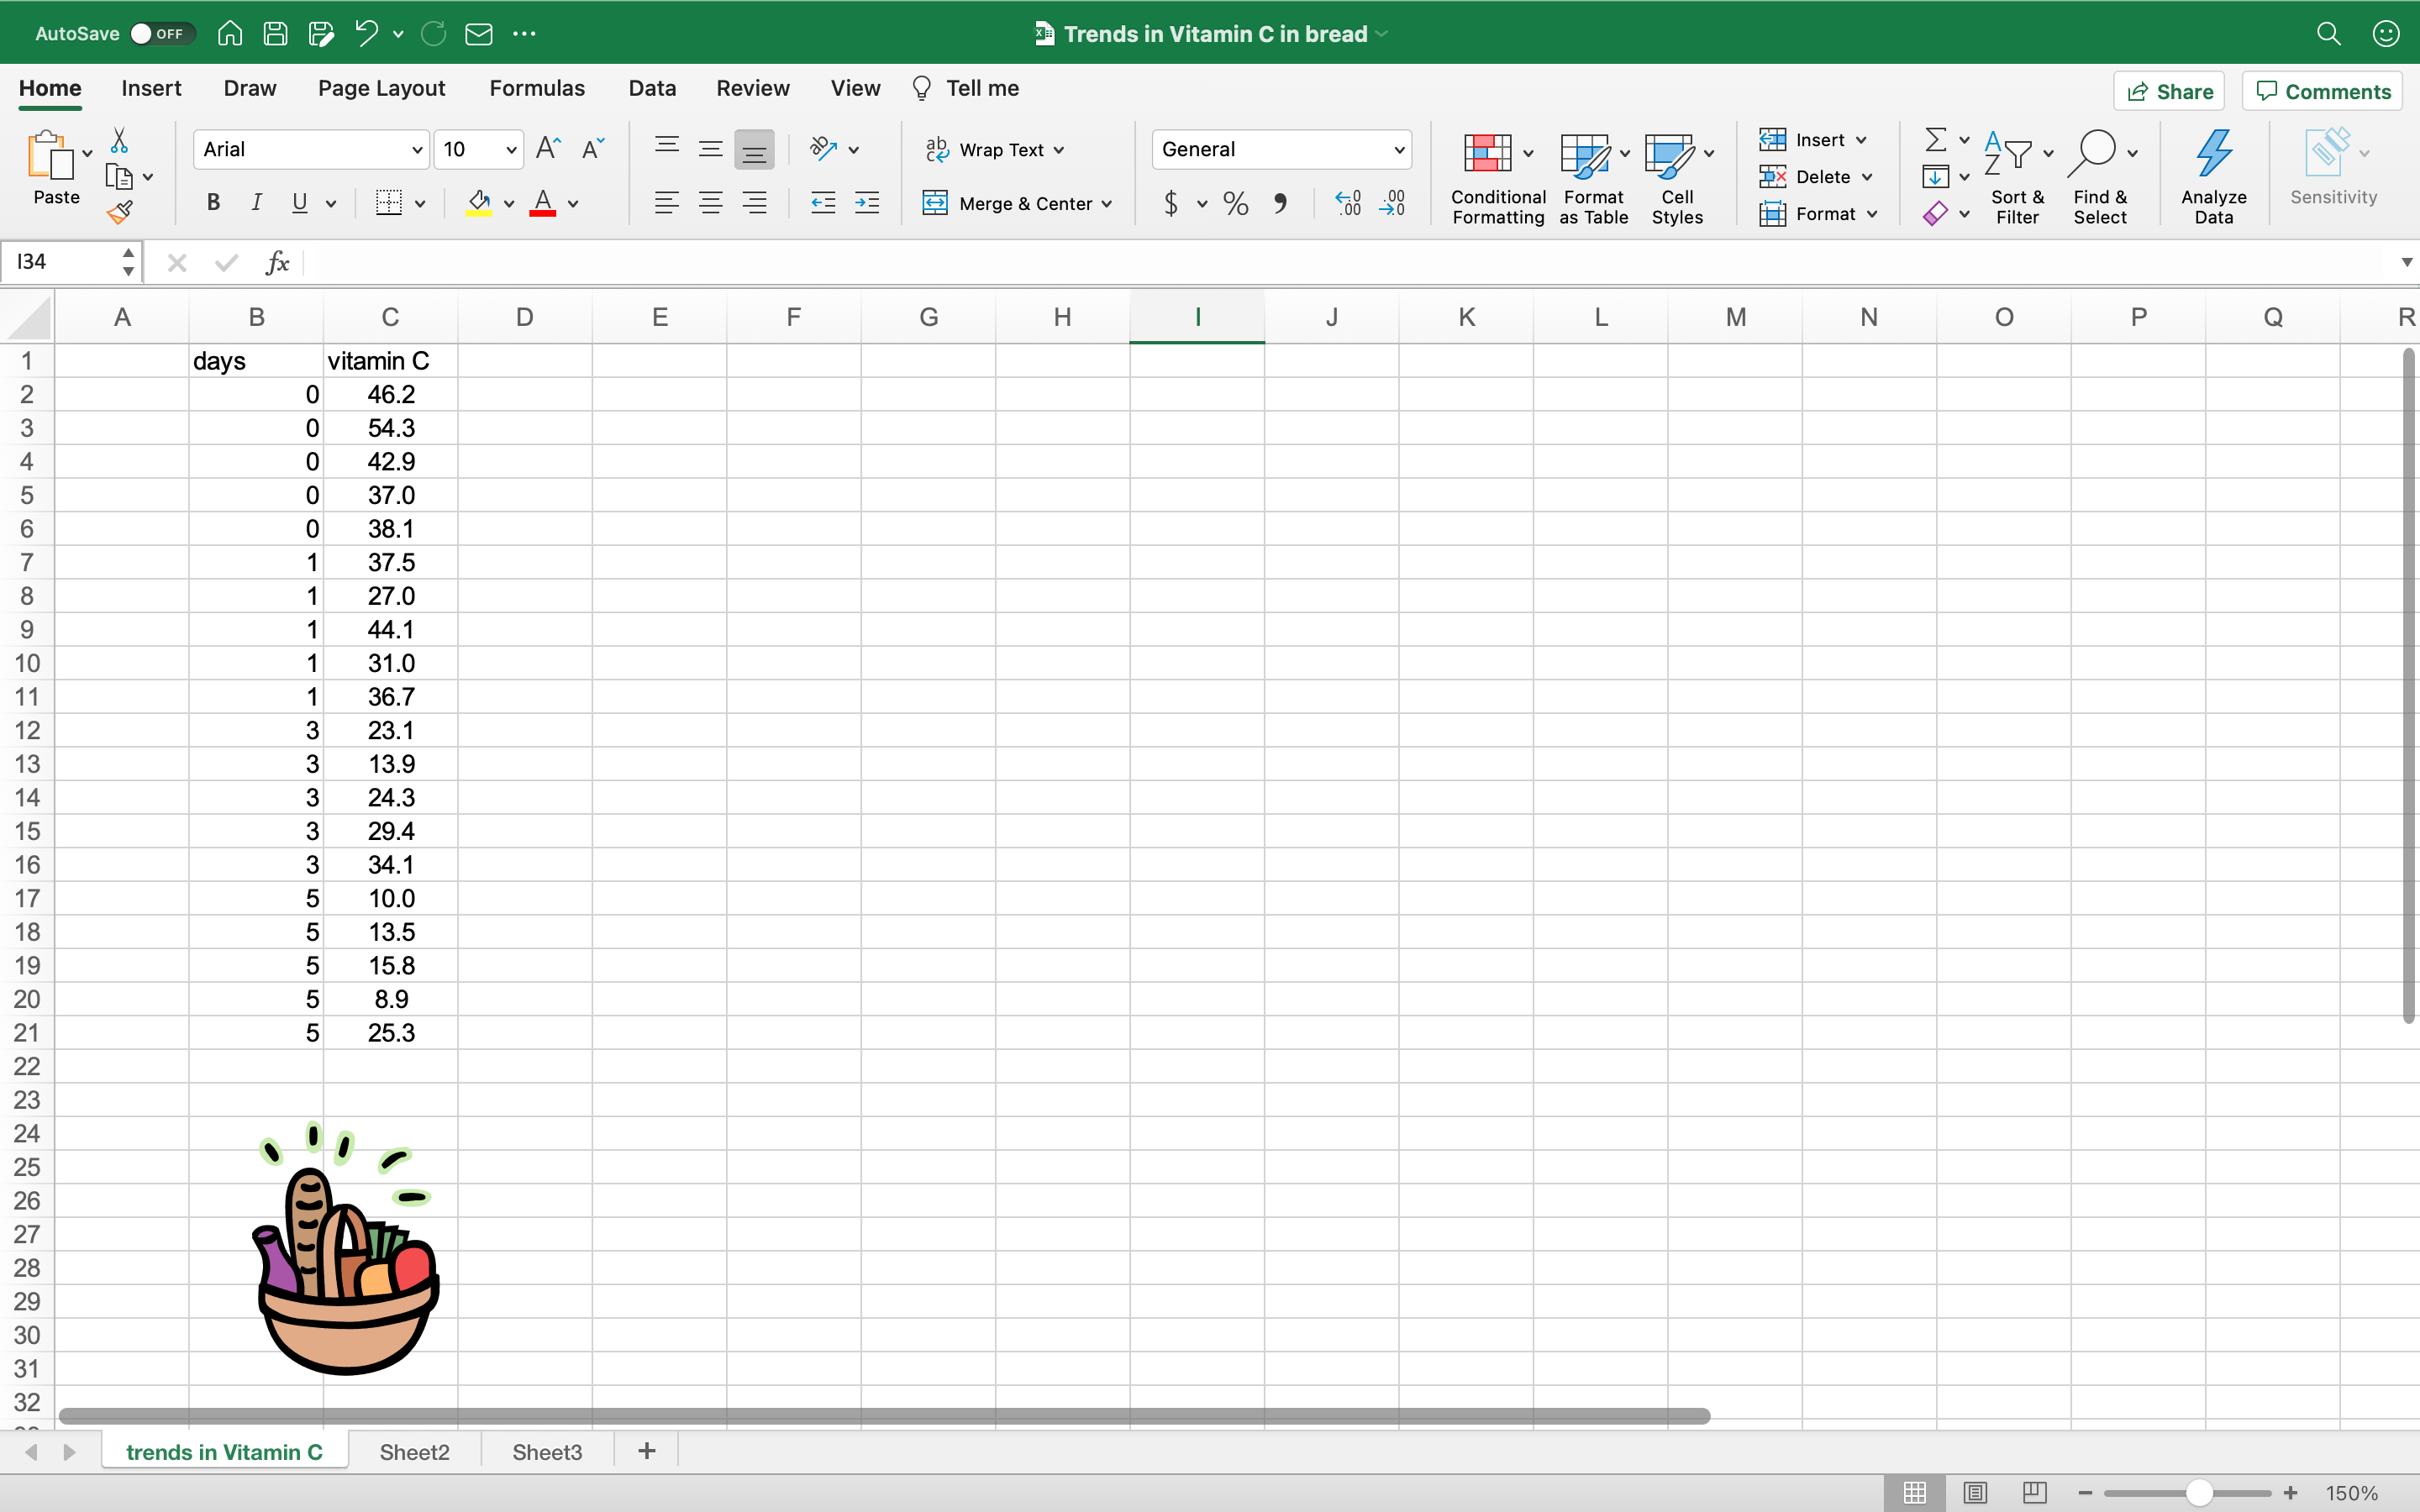
Using the equation from the above answer, predict vitamin C content when day=2. Include the answer on the spreadsheet.
AutoSave OFF n A F . CO ... 3. Trends in Vitamin C in bread View Tell me Share Comments Home Insert Draw Page Layout Formulas Data Review Insert v AA ae Wrap Text v General Ex AP- O. 4 Arial v 10 = Ex Delete v v Z Merge & Center v $ ~ % 9 Conditional Format Cell Sort & Find & nalyze Sensitivity Paste BIUV DVAv E Formatting as Table Styles Format v Filter Select Data 134 fx E F G H I J K L M N O P Q A B C D days vitamin C 0 46.2 W N . 54.3 oo 42.9 37.0 O 38.1 37.5 27.0 44.1 31.0 36.7 23.1 13.9 24.3 29.4 34.1 10.0 13.5 15.8 8.9 25.3 24 25 26 IN 28 29 30 31 32 4 trends in Vitamin C Sheet2 Sheet3 + + 150%
Step by Step Solution
There are 3 Steps involved in it

Get step-by-step solutions from verified subject matter experts