

Question: how do you put this into excel to plot a chart and figure the equation? 5-48. The prospective exploration for oil in the outer continental
how do you put this into excel to plot a chart and figure the equation?
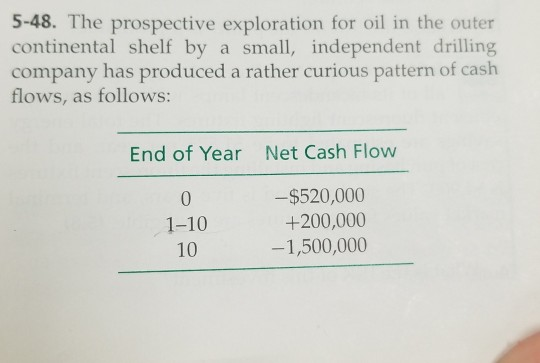
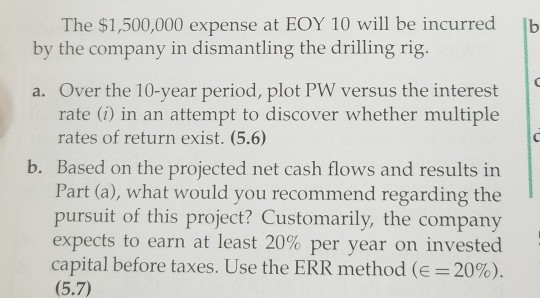
5-48. The prospective exploration for oil in the outer continental shelf by a small, independent drilling company has produced a rather curious pattern of cash flows, as follows: End of Year Net Cash Flow 1-10 10 $520,000 +200,000 1,500,000 The $1,500,000 expense at EOY 10 will be incurred b by the company in dismantling the drilling rig. a. Over the 10-year period, plot PW versus the interest rate (i) in an attempt to discover whether multiple rates of return exist. (5.6) b. Based on the projected net cash flows and results in Part (a), what would you recommend regarding the pursuit of this project? Customarily, the company expects to earn at least 20% per year on invested capital before taxes. Use the ERR method (e-20%). (5.7)
Step by Step Solution
There are 3 Steps involved in it

Get step-by-step solutions from verified subject matter experts