

Question: How do you set up a graph like this in excel? 2. Make a spreadsheet that produces a wiremesh plot ofteretin of a dipole. Remember
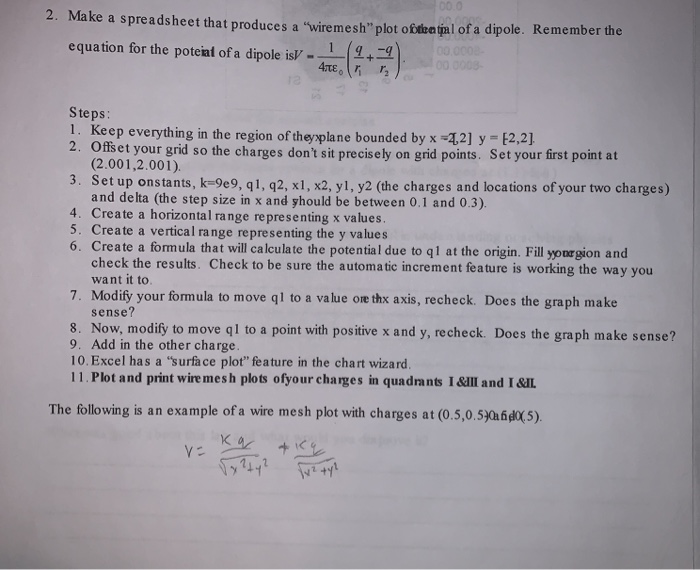
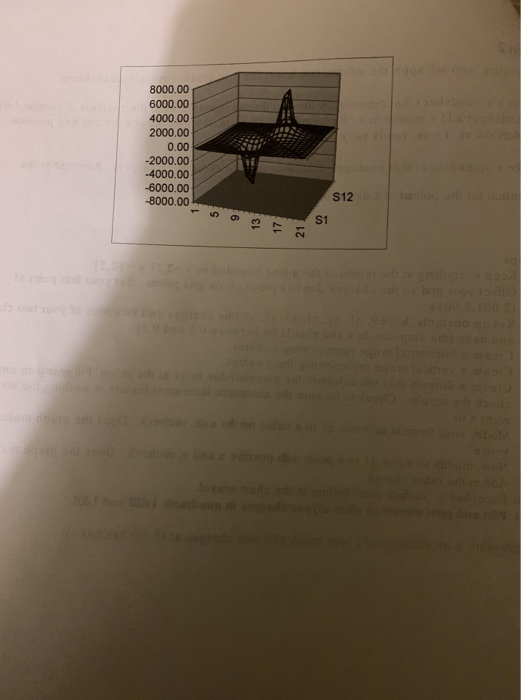
2. Make a spreadsheet that produces a "wiremesh" plot ofteretin of a dipole. Remember the equation for the potent of a dipole is ---(2+2). 4ter 1 Steps: 1. Keep everything in the region of the plane bounded by x -22] y = F2,2] 2. Offset your grid so the charges don't sit precisely on grid points. Set your first point at (2.001,2.001). 3. Set up onstants, k=9e9, 91, 92, x1, x2, yl, y2 (the charges and locations of your two charges) and delta (the step size in x and yhould be between 0.1 and 0.3). 4. Create a horizontal range representing x values. 5. Create a vertical range representing the y values 6. Create a formula that will calculate the potential due to 1 at the origin. Fill yourgion and check the results. Check to be sure the automatic increment feature is working the way you want it to 7. Modify your formula to move ql to a value ore thx axis, recheck. Does the graph make sense? 8. Now, modify to move ql to a point with positive x and y, recheck. Does the graph make sense? 9. Add in the other charge. 10. Excel has a "surface plot" feature in the chart wizard 11. Plot and print wire mesh plots ofyour charges in quadrants 1&III and I &IL The following is an example of a wire mesh plot with charges at (0.5,0.5702640X, 5). ka & kq 8000.00 6000.00 4000.00 2000.00 0.00 -2000.00 -4000.00 -6000.00 -8000.00 S12 2. Make a spreadsheet that produces a "wiremesh" plot ofteretin of a dipole. Remember the equation for the potent of a dipole is ---(2+2). 4ter 1 Steps: 1. Keep everything in the region of the plane bounded by x -22] y = F2,2] 2. Offset your grid so the charges don't sit precisely on grid points. Set your first point at (2.001,2.001). 3. Set up onstants, k=9e9, 91, 92, x1, x2, yl, y2 (the charges and locations of your two charges) and delta (the step size in x and yhould be between 0.1 and 0.3). 4. Create a horizontal range representing x values. 5. Create a vertical range representing the y values 6. Create a formula that will calculate the potential due to 1 at the origin. Fill yourgion and check the results. Check to be sure the automatic increment feature is working the way you want it to 7. Modify your formula to move ql to a value ore thx axis, recheck. Does the graph make sense? 8. Now, modify to move ql to a point with positive x and y, recheck. Does the graph make sense? 9. Add in the other charge. 10. Excel has a "surface plot" feature in the chart wizard 11. Plot and print wire mesh plots ofyour charges in quadrants 1&III and I &IL The following is an example of a wire mesh plot with charges at (0.5,0.5702640X, 5). ka & kq 8000.00 6000.00 4000.00 2000.00 0.00 -2000.00 -4000.00 -6000.00 -8000.00 S12
Step by Step Solution
There are 3 Steps involved in it

Get step-by-step solutions from verified subject matter experts