

Question: How do you solve d e and f in excel when you don't have the sample data set? To receive full marks, you need to
How do you solve d e and f in excel when you don't have the sample data set?
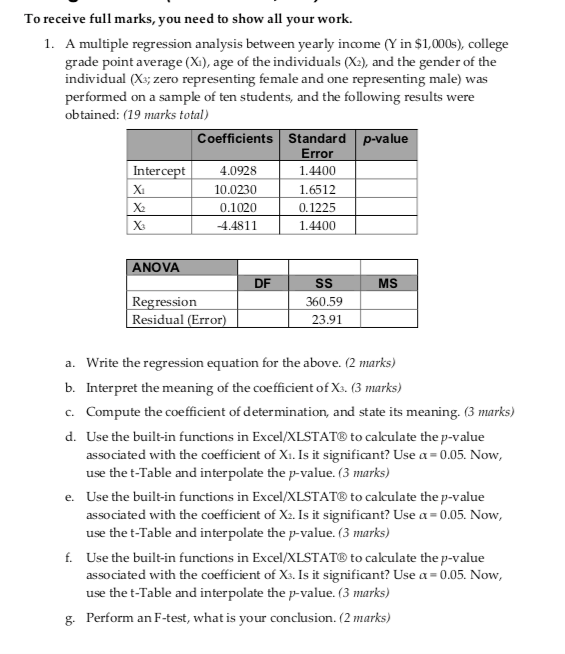
To receive full marks, you need to show all your work. 1. A multiple regression analysis between yearly income (Yin $1,000s), college grade point average (Xi), age of the individuals (X2), and the gender of the individual (Xs, zero representing female and one representing male) was performed on a sample of ten students, and the following results were obtained: (19 marks total) Coefficients Standard p-value Error Intercept 4.0928 1.4400 10.0230 1.6512 0.1020 0.1225 4.4811 1.4400 ANOVA DF MS Regression Residual (Error) SS 360.59 23.91 a. Write the regression equation for the above. (2 marks) b. Interpret the meaning of the coefficient of X3. (3 marks) c. Compute the coefficient of determination, and state its meaning. (3 marks) d. Use the built-in functions in Excel/XLSTAT to calculate the p-value associated with the coefficient of X1. Is it significant? Use a-0.05. Now, use the t-Table and interpolate the p-value. (3 marks) e. Use the built-in functions in Excel/XLSTAT to calculate the p-value associated with the coefficient of X2. Is it significant? Use a -0.05. Now, use the t-Table and interpolate the p-value. (3 marks) f. Use the built-in functions in Excel/XLSTAT to calculate the p-value associated with the coefficient of X3. Is it significant? Use a 0.05. Now, use the t-Table and interpolate the p-value. (3 marks) g. Perform an F-test, what is your conclusion. (2 marks)Step by Step Solution
There are 3 Steps involved in it
1 Expert Approved Answer
Step: 1 Unlock

Question Has Been Solved by an Expert!
Get step-by-step solutions from verified subject matter experts
Step: 2 Unlock
Step: 3 Unlock