

Question: How does the graph relate to AD-AS model? 1. How does the graph below relate to AD-AS model we have created? Provide specific detai in
How does the graph relate to AD-AS model?

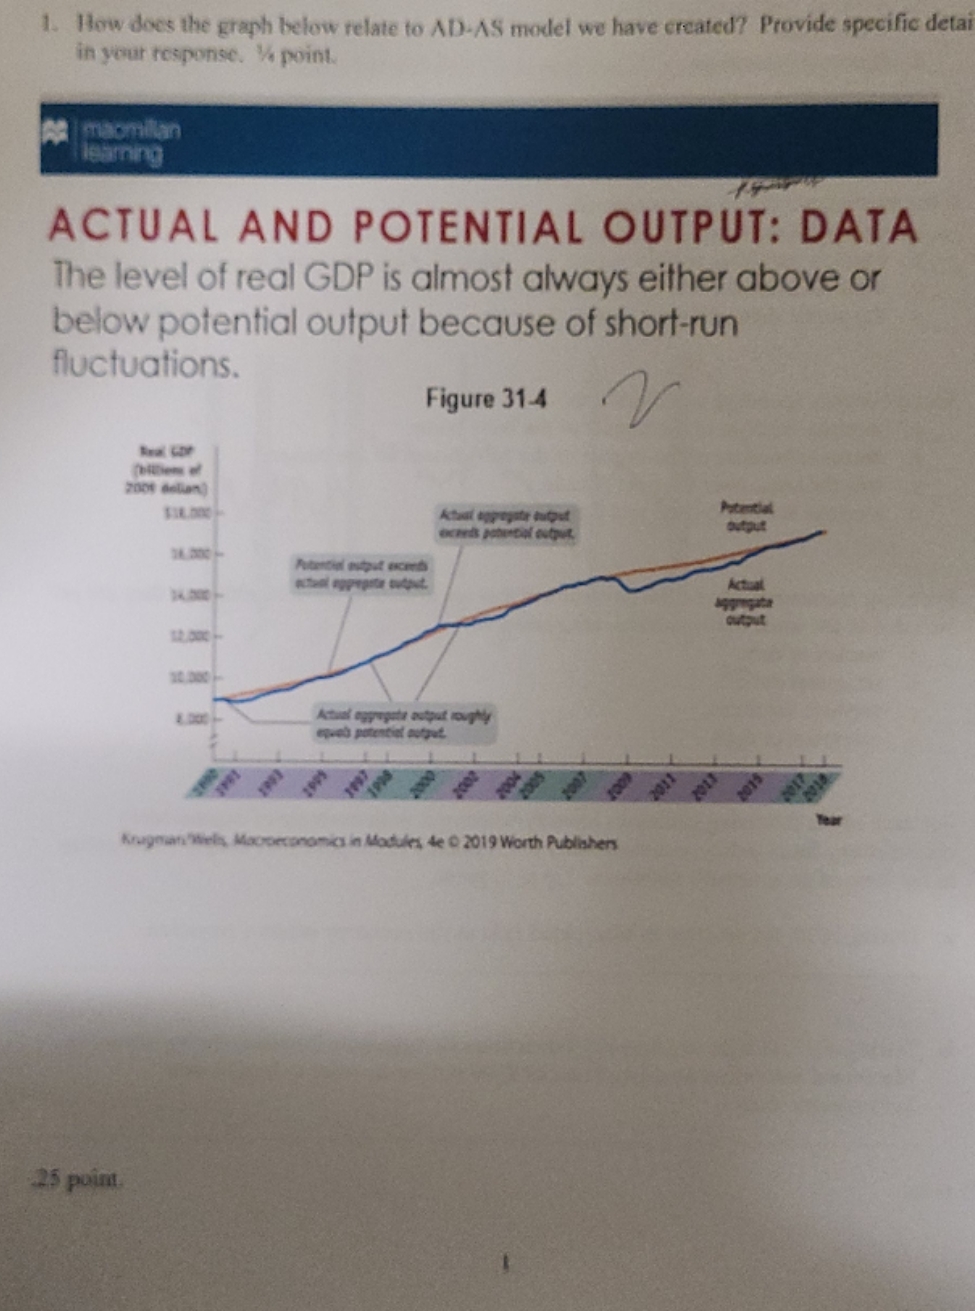
1. How does the graph below relate to AD-AS model we have created? Provide specific detai in your response. " point macmillan learning ACTUAL AND POTENTIAL OUTPUT: DATA The level of real GDP is almost always either above or below potential output because of short-run fluctuations. Figure 31-4 V 2009 Golan output itand appopeter output. Actual oppupate output roughly Krugman Wein Macroeconomics in Modules, de D 2019 Worth Publishers 25 point
Step by Step Solution
There are 3 Steps involved in it
1 Expert Approved Answer
Step: 1 Unlock

Question Has Been Solved by an Expert!
Get step-by-step solutions from verified subject matter experts
Step: 2 Unlock
Step: 3 Unlock