Question: How does the interpretation of probability differ between null hypothesis significance tests and Bayesian statistics? Group of answer choices NHST views probability as long-run frequencies,
How does the interpretation of probability differ between null hypothesis significance tests and Bayesian statistics?
Group of answer choices
NHST views probability as long-run frequencies, while Bayesian statistics view probability as a degree of belief for an event
NHST views probability as a degree of belief for an event, while Bayesian statistics view probability as long-run frequencies
NHST solely uses simple probabilities, while Bayesian statistics solely use conditional probabilities
NHST solely uses conditional probabilities, while Bayesian statistics solely use simple probabilities
NHST and Bayesian statistics treat probability in the same way
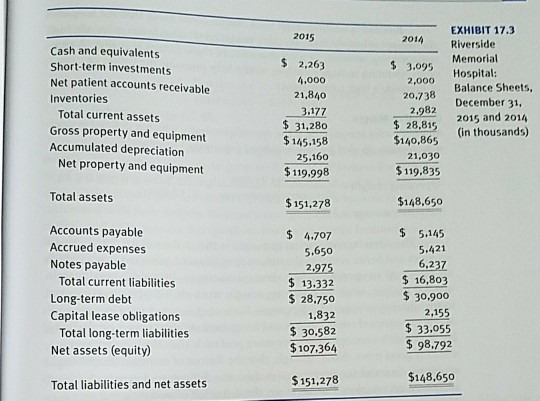
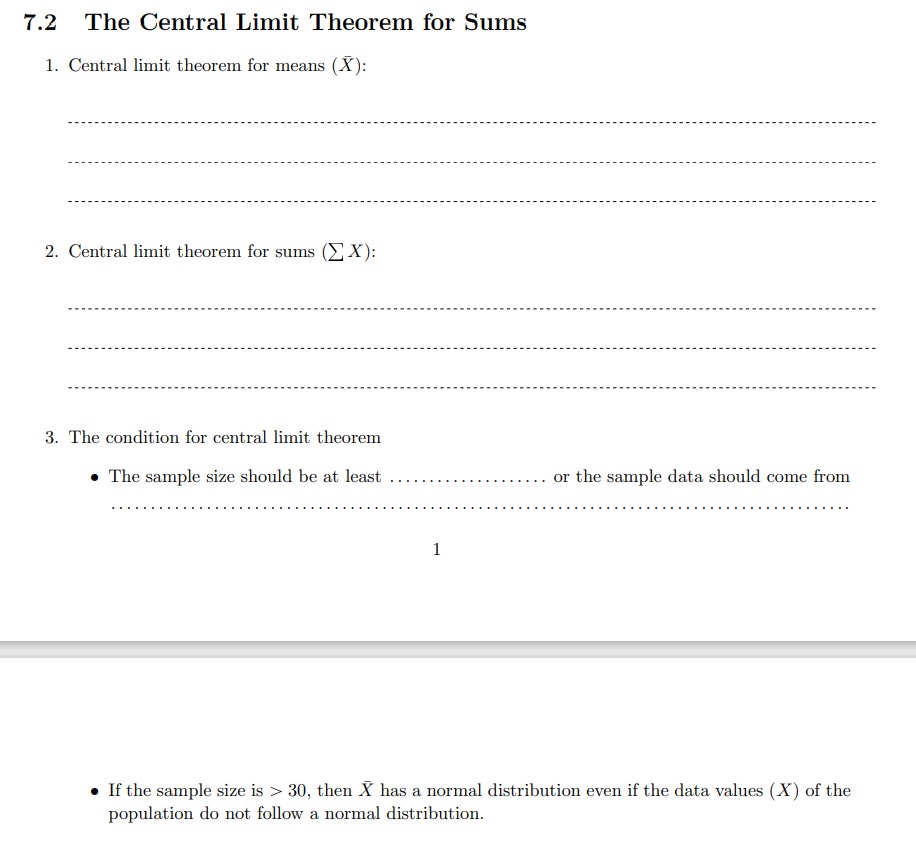
Direct finance is borrowing while indirect finance is borrowing from financial intermediaries If you borrow money from a using finance. via financial markets from retained earnings from savers from shareholdersEXHIBIT 17.3 2015 2014 Riverside Cash and equivalents $ 2.263 Memorial Short-term investments $ 3.095 Hospital: Net patient accounts receivable 4,000 2,000 Balance Sheets, Inventories 21,840 20.738 December 31, Total current assets 3.177 2.982 2015 and 2014 $ 31,280 $ 28.815 Gross property and equipment (in thousands) $ 145.158 $140.865 Accumulated depreciation 25.160 21,030 Net property and equipment $ 119.998 $ 119.835 Total assets $ 151,278 $148.650 Accounts payable $ 4.707 $ 5.145 Accrued expenses 5.650 5.421 Notes payable 2.975 6.237 Total current liabilities $ 13.332 $ 16,803 Long-term debt $ 28.750 $ 30,900 Capital lease obligations 1,832 2.155 Total long-term liabilities $ 30,582 $ 33.055 Net assets (equity) $ 107.364 $ 98.792 Total liabilities and net assets $ 151,278 $148,6507.2 The Central Limit Theorem for Sums 1. Central limit theorem for means {X}: 3. The condition for central limit theorem I The sample size should be at least .................... or the sample data should come from a if the sample size is :5 30, then X has a normal distribution even if the data values (X) of the population do not follow a normal distribution