

Question: How does the stem-and-leaf plot show the distribution of these data? O A. The lengths of the rows are similar to the widths of
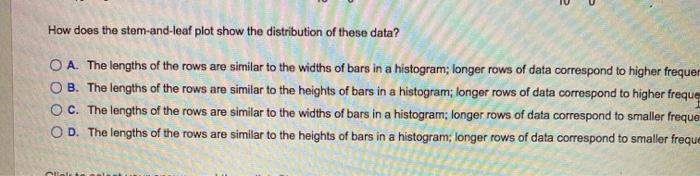
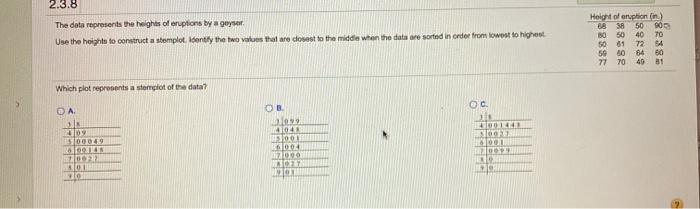
How does the stem-and-leaf plot show the distribution of these data? O A. The lengths of the rows are similar to the widths of bars in a histogram; longer rows of data correspond to higher frequer O B. The lengths of the rows are similar to the heights of bars in a histogram; longer rows of data correspond to higher freque O C. The lengths of the rows are similar to the widths of bars in a histogram; longer rows of data correspond to smaller freque O D. The lengths of the rows are similar to the heights of bars in a histogram; longer rows of data correspond to smaller freque 2.3.8 Height of enuption (in.) The data represents the heights of eruptions by a geyser. 68 50 90 38 40 70 80 60 Use the heights to construct a stemplot. identify the two values that are dosest to the midde when the data are sorted in order from lowest to highest 50 61 72 54 59 60 64 60 77 70 49 Which plot represents a stempiot of the data? OB. OC. OA. 400144 141048 00049 6l004
Step by Step Solution
3.56 Rating (160 Votes )
There are 3 Steps involved in it
Page Soluton Hese n 1O stemleaf plot is stem leaves 7 25 6 ... View full answer

Get step-by-step solutions from verified subject matter experts