

Question: How does this compare to the mean median mode Using your data from the Discussion from Week 2, go back and perform a linear regression.
How does this compare to the mean median mode
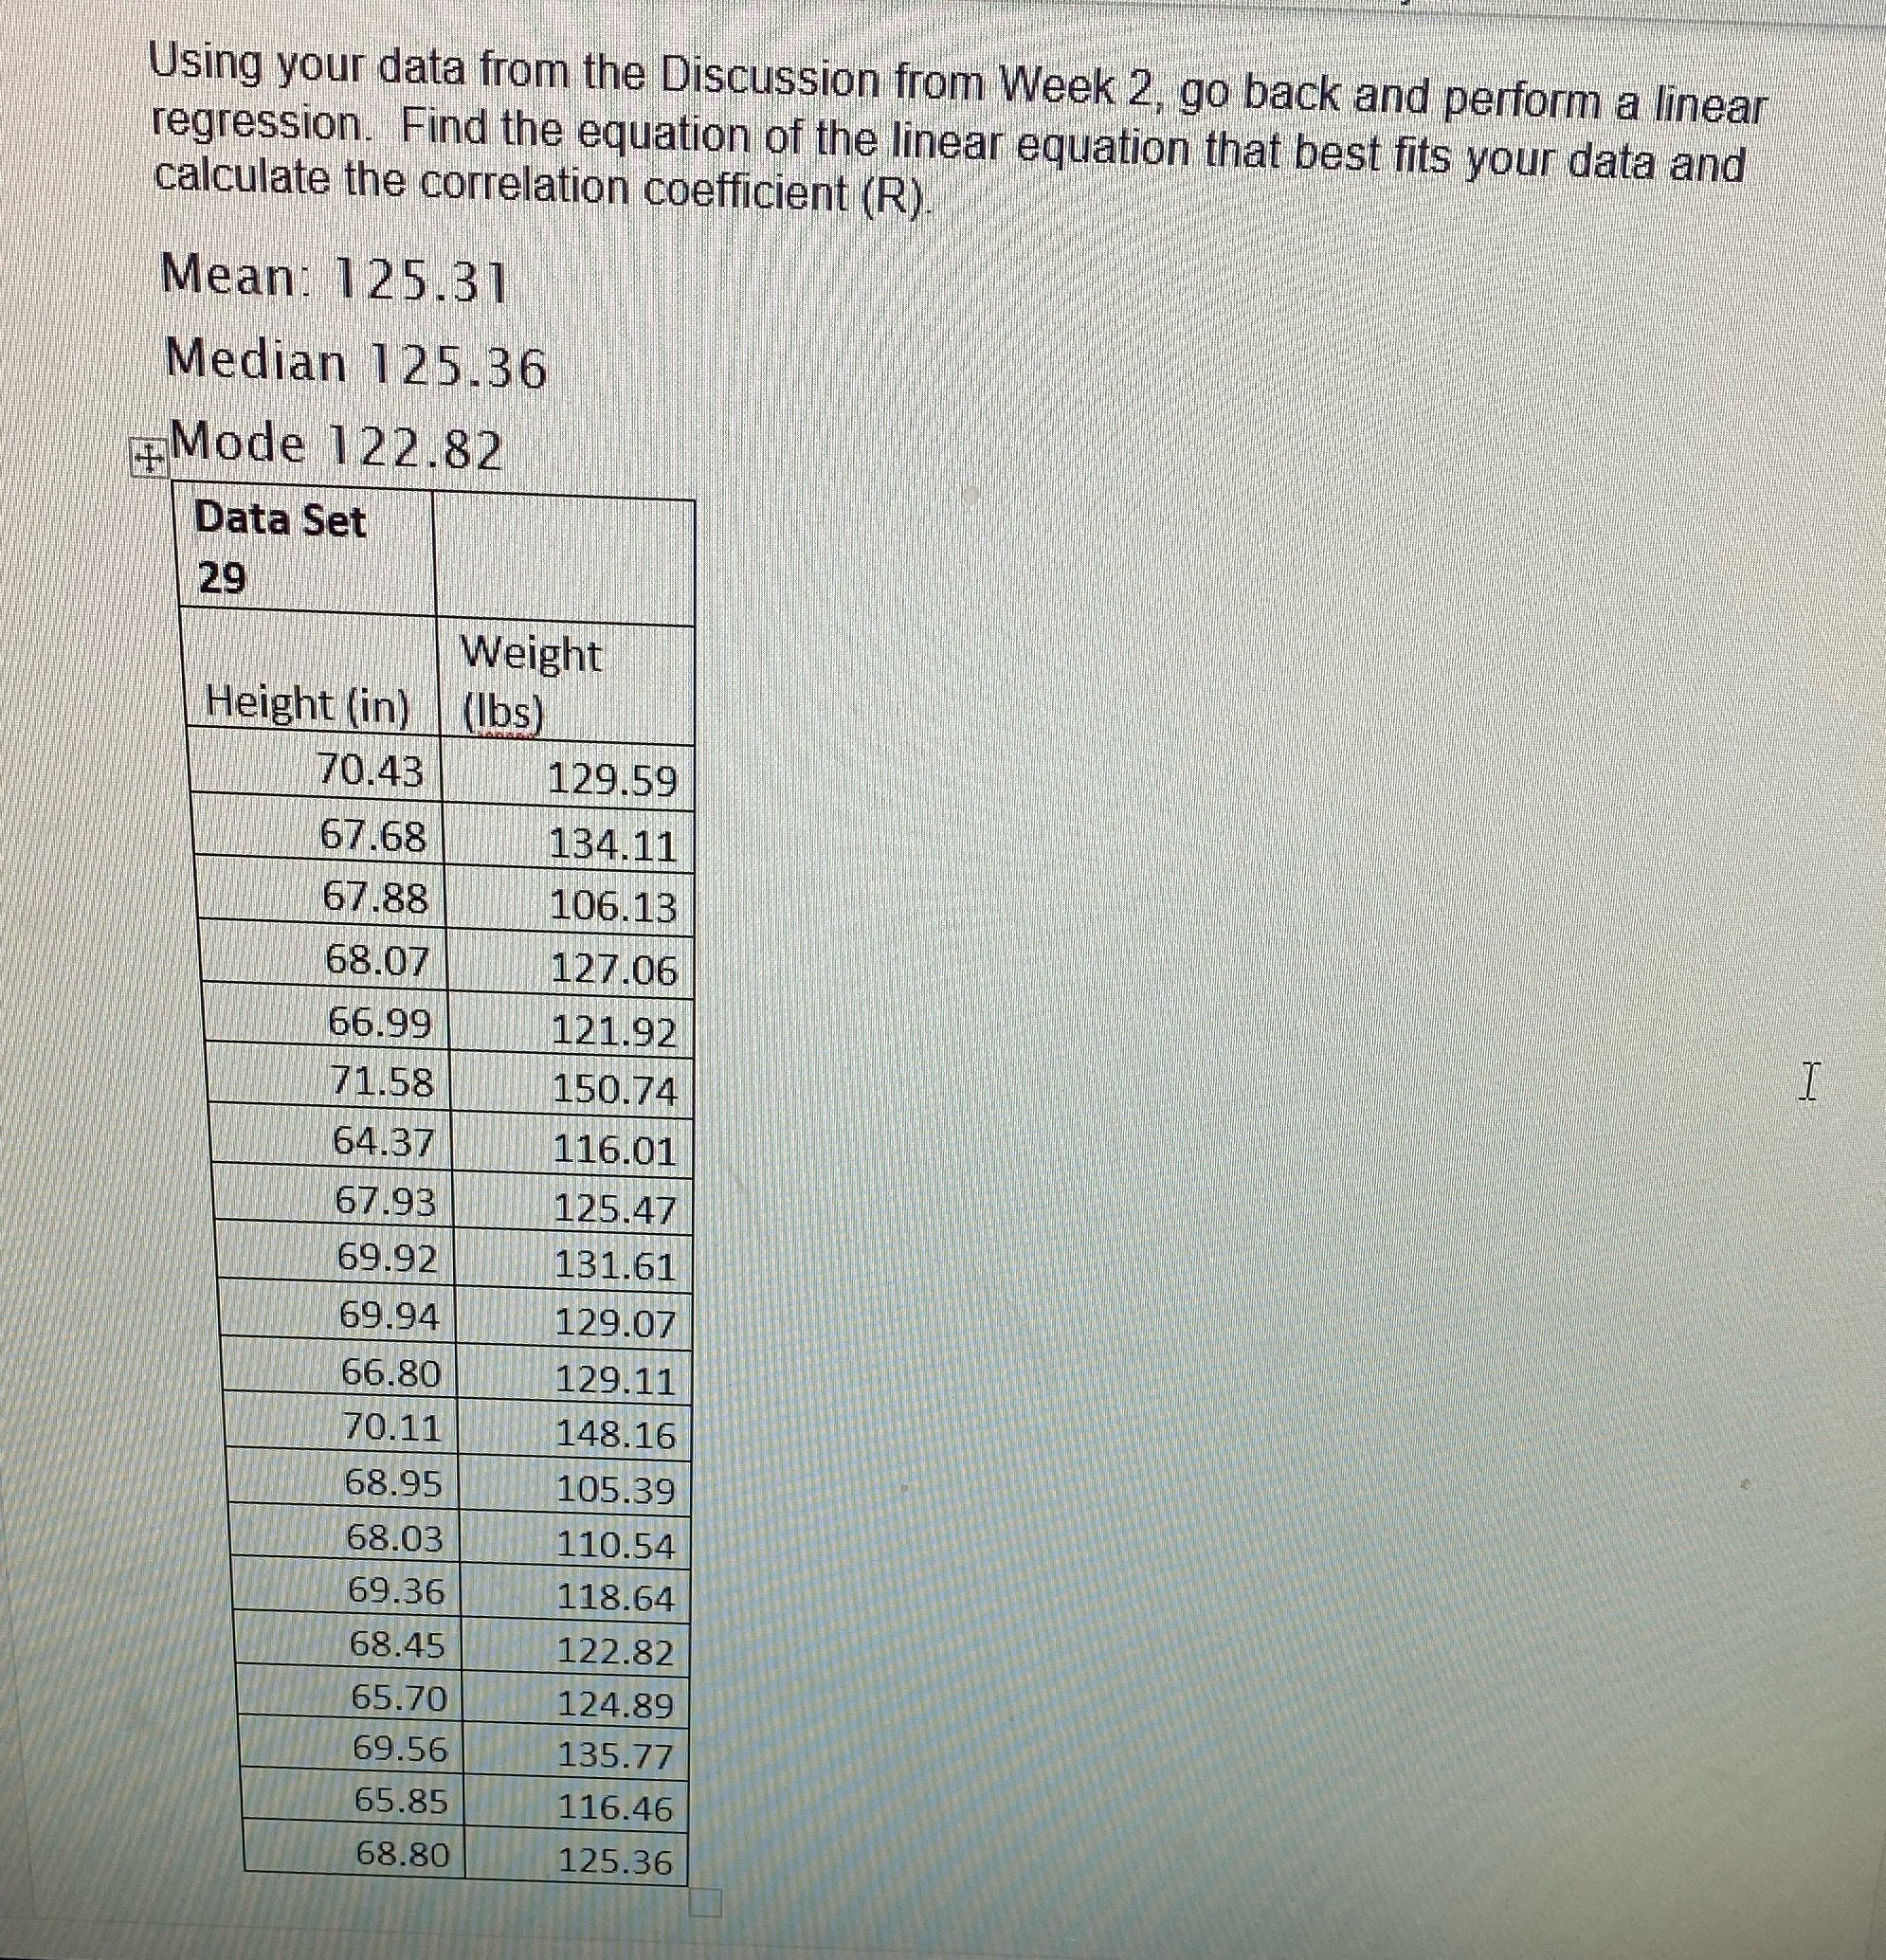
Using your data from the Discussion from Week 2, go back and perform a linear regression. Find the equation of the linear equation that best fits your data and calculate the correlation coefficient (R) Mean: 125.31 Median 125.36 Mode 122.82 Data Set 29 Weight Height (in) (lbs) 70.43 129.59 67.68 134.11 67.88 106.13 68.07 127.06 66.99 121.92 71.58 150.74 64.37 116.01 67.93 125.47 69.92 131.61 69.94 129.07 66.80 129.11 70.11 148.16 68.95 105.39 68.03 110.54 69.36 118.64 68.45 122.82 65.70 124.89 69.56 135.77 65.85 116.46 68.80 125.36
Step by Step Solution
There are 3 Steps involved in it
1 Expert Approved Answer
Step: 1 Unlock

Question Has Been Solved by an Expert!
Get step-by-step solutions from verified subject matter experts
Step: 2 Unlock
Step: 3 Unlock