Question: How does Thor's inventory days compare with - Winnebago? - Skyline? (Using the same method of accounting for Inventory) Exlglbit l. Thor's Recent Stock Price
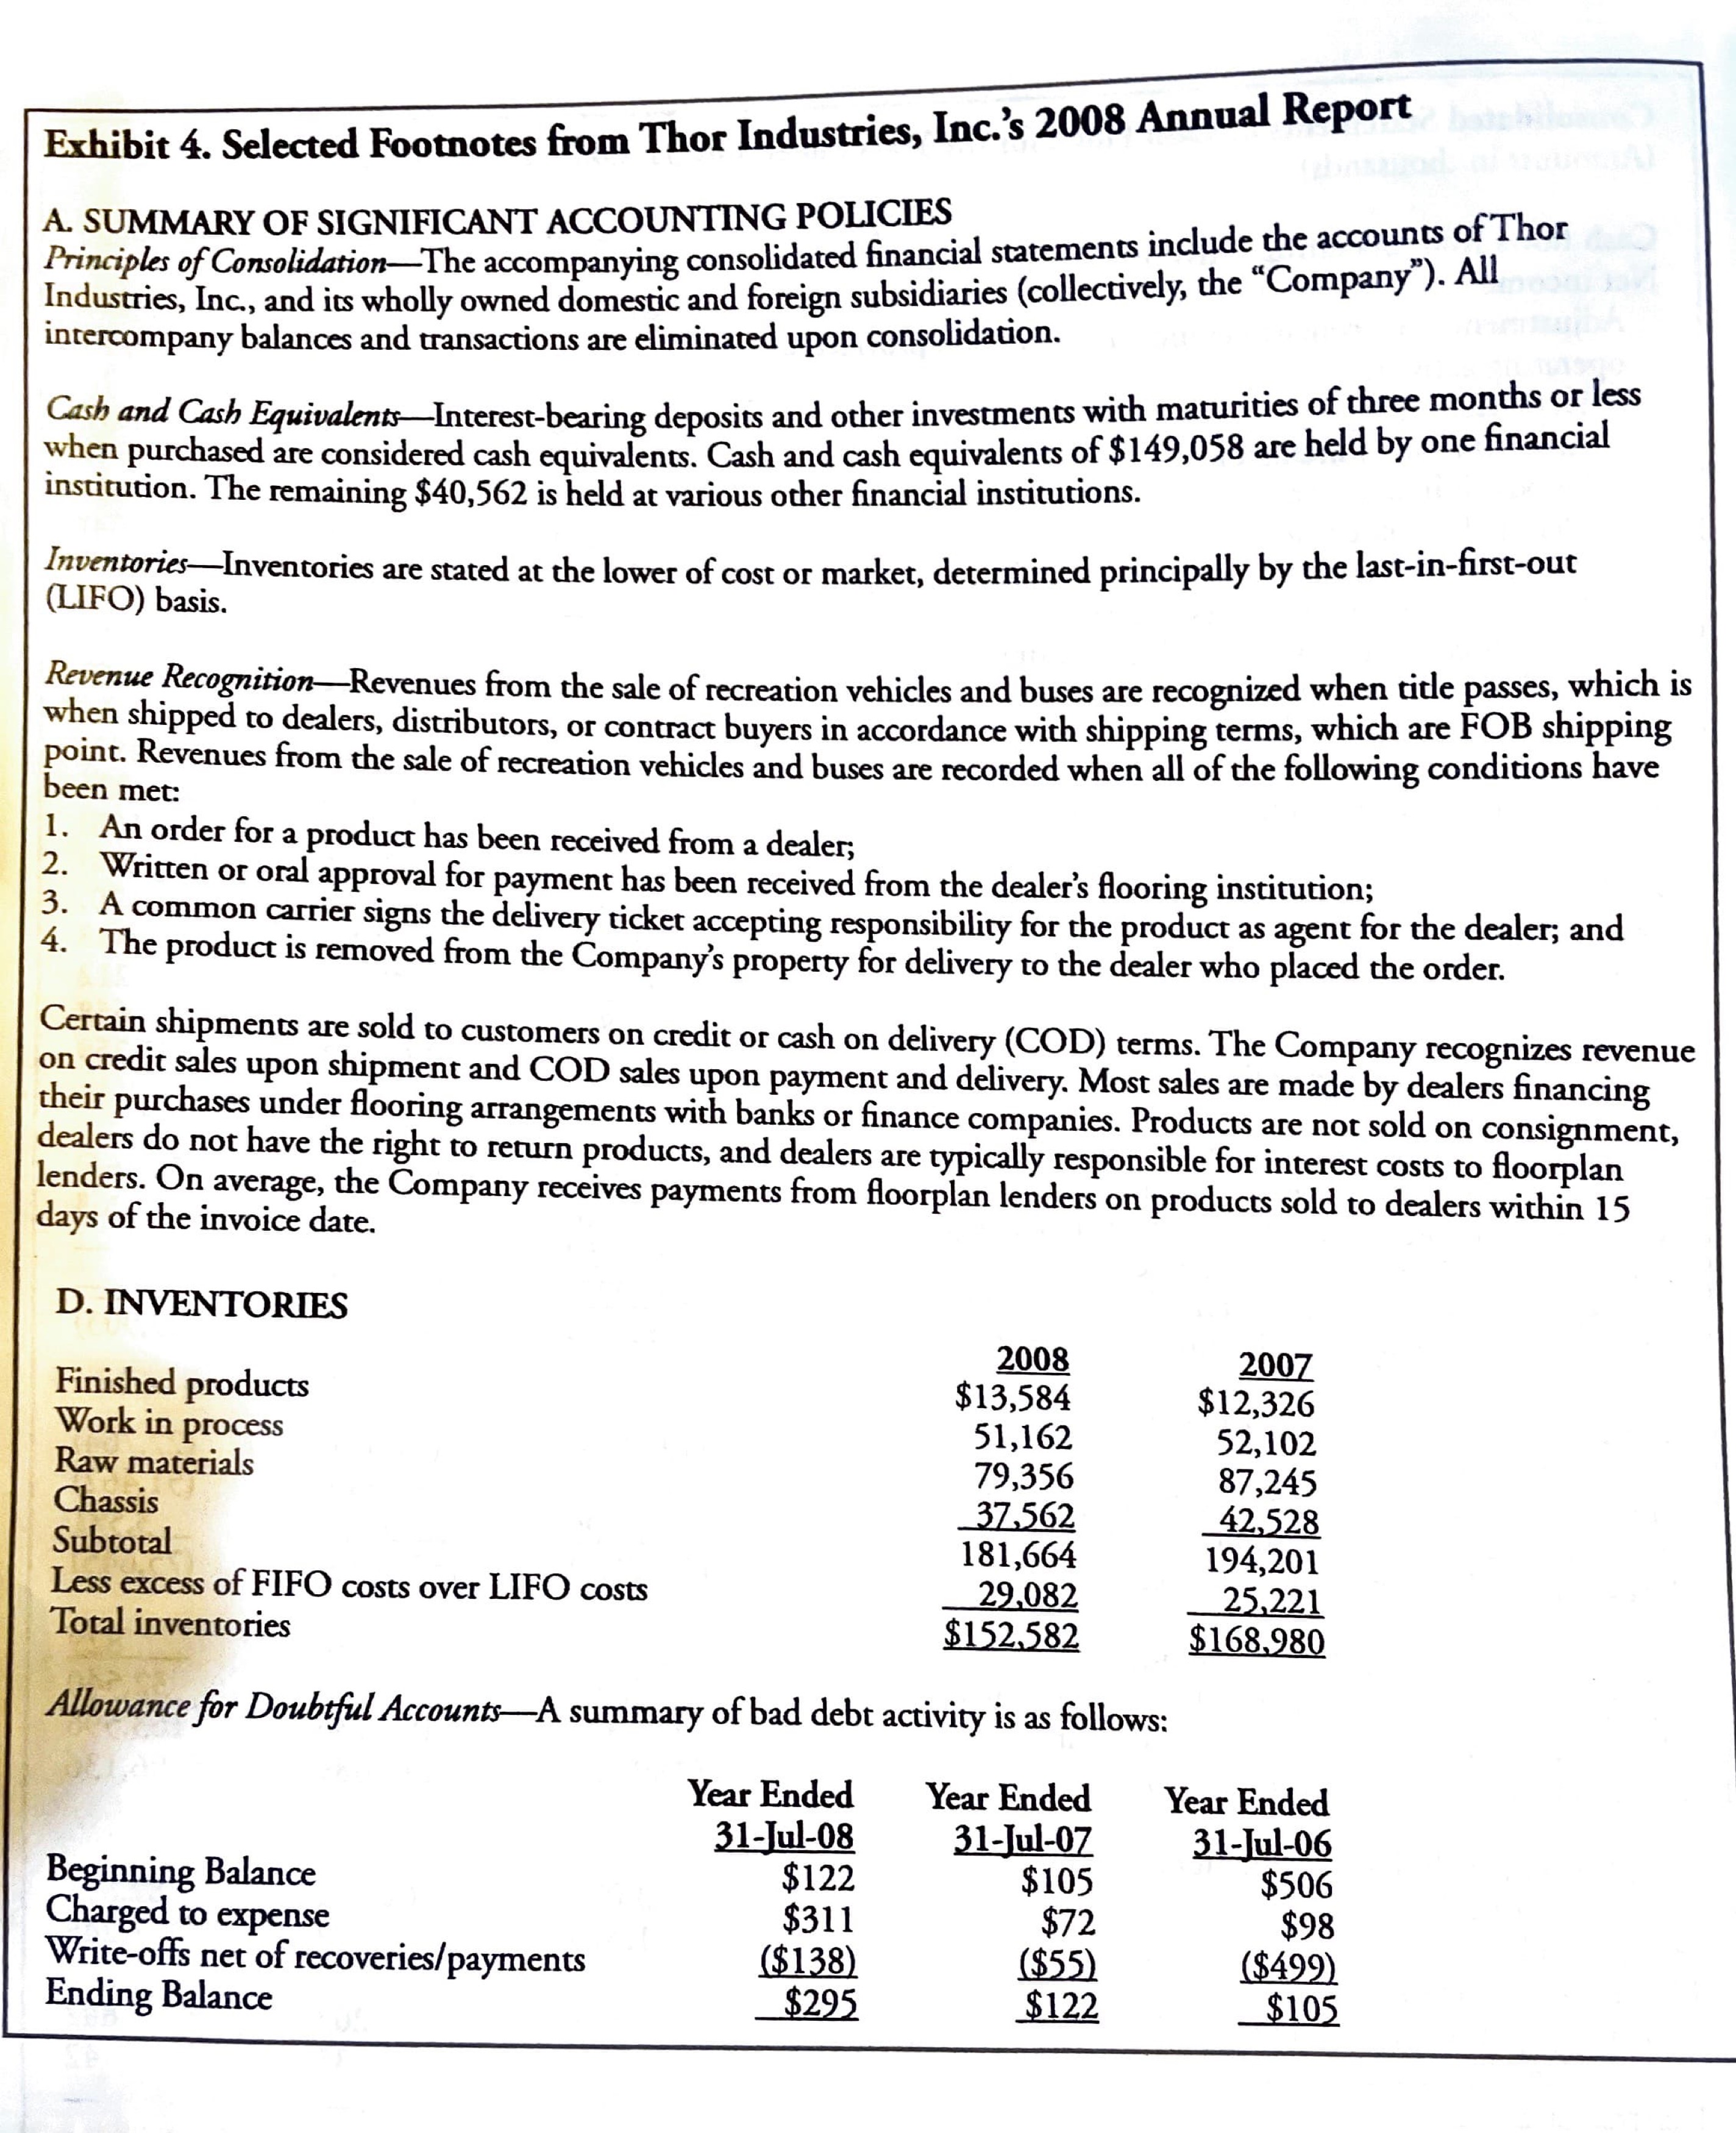
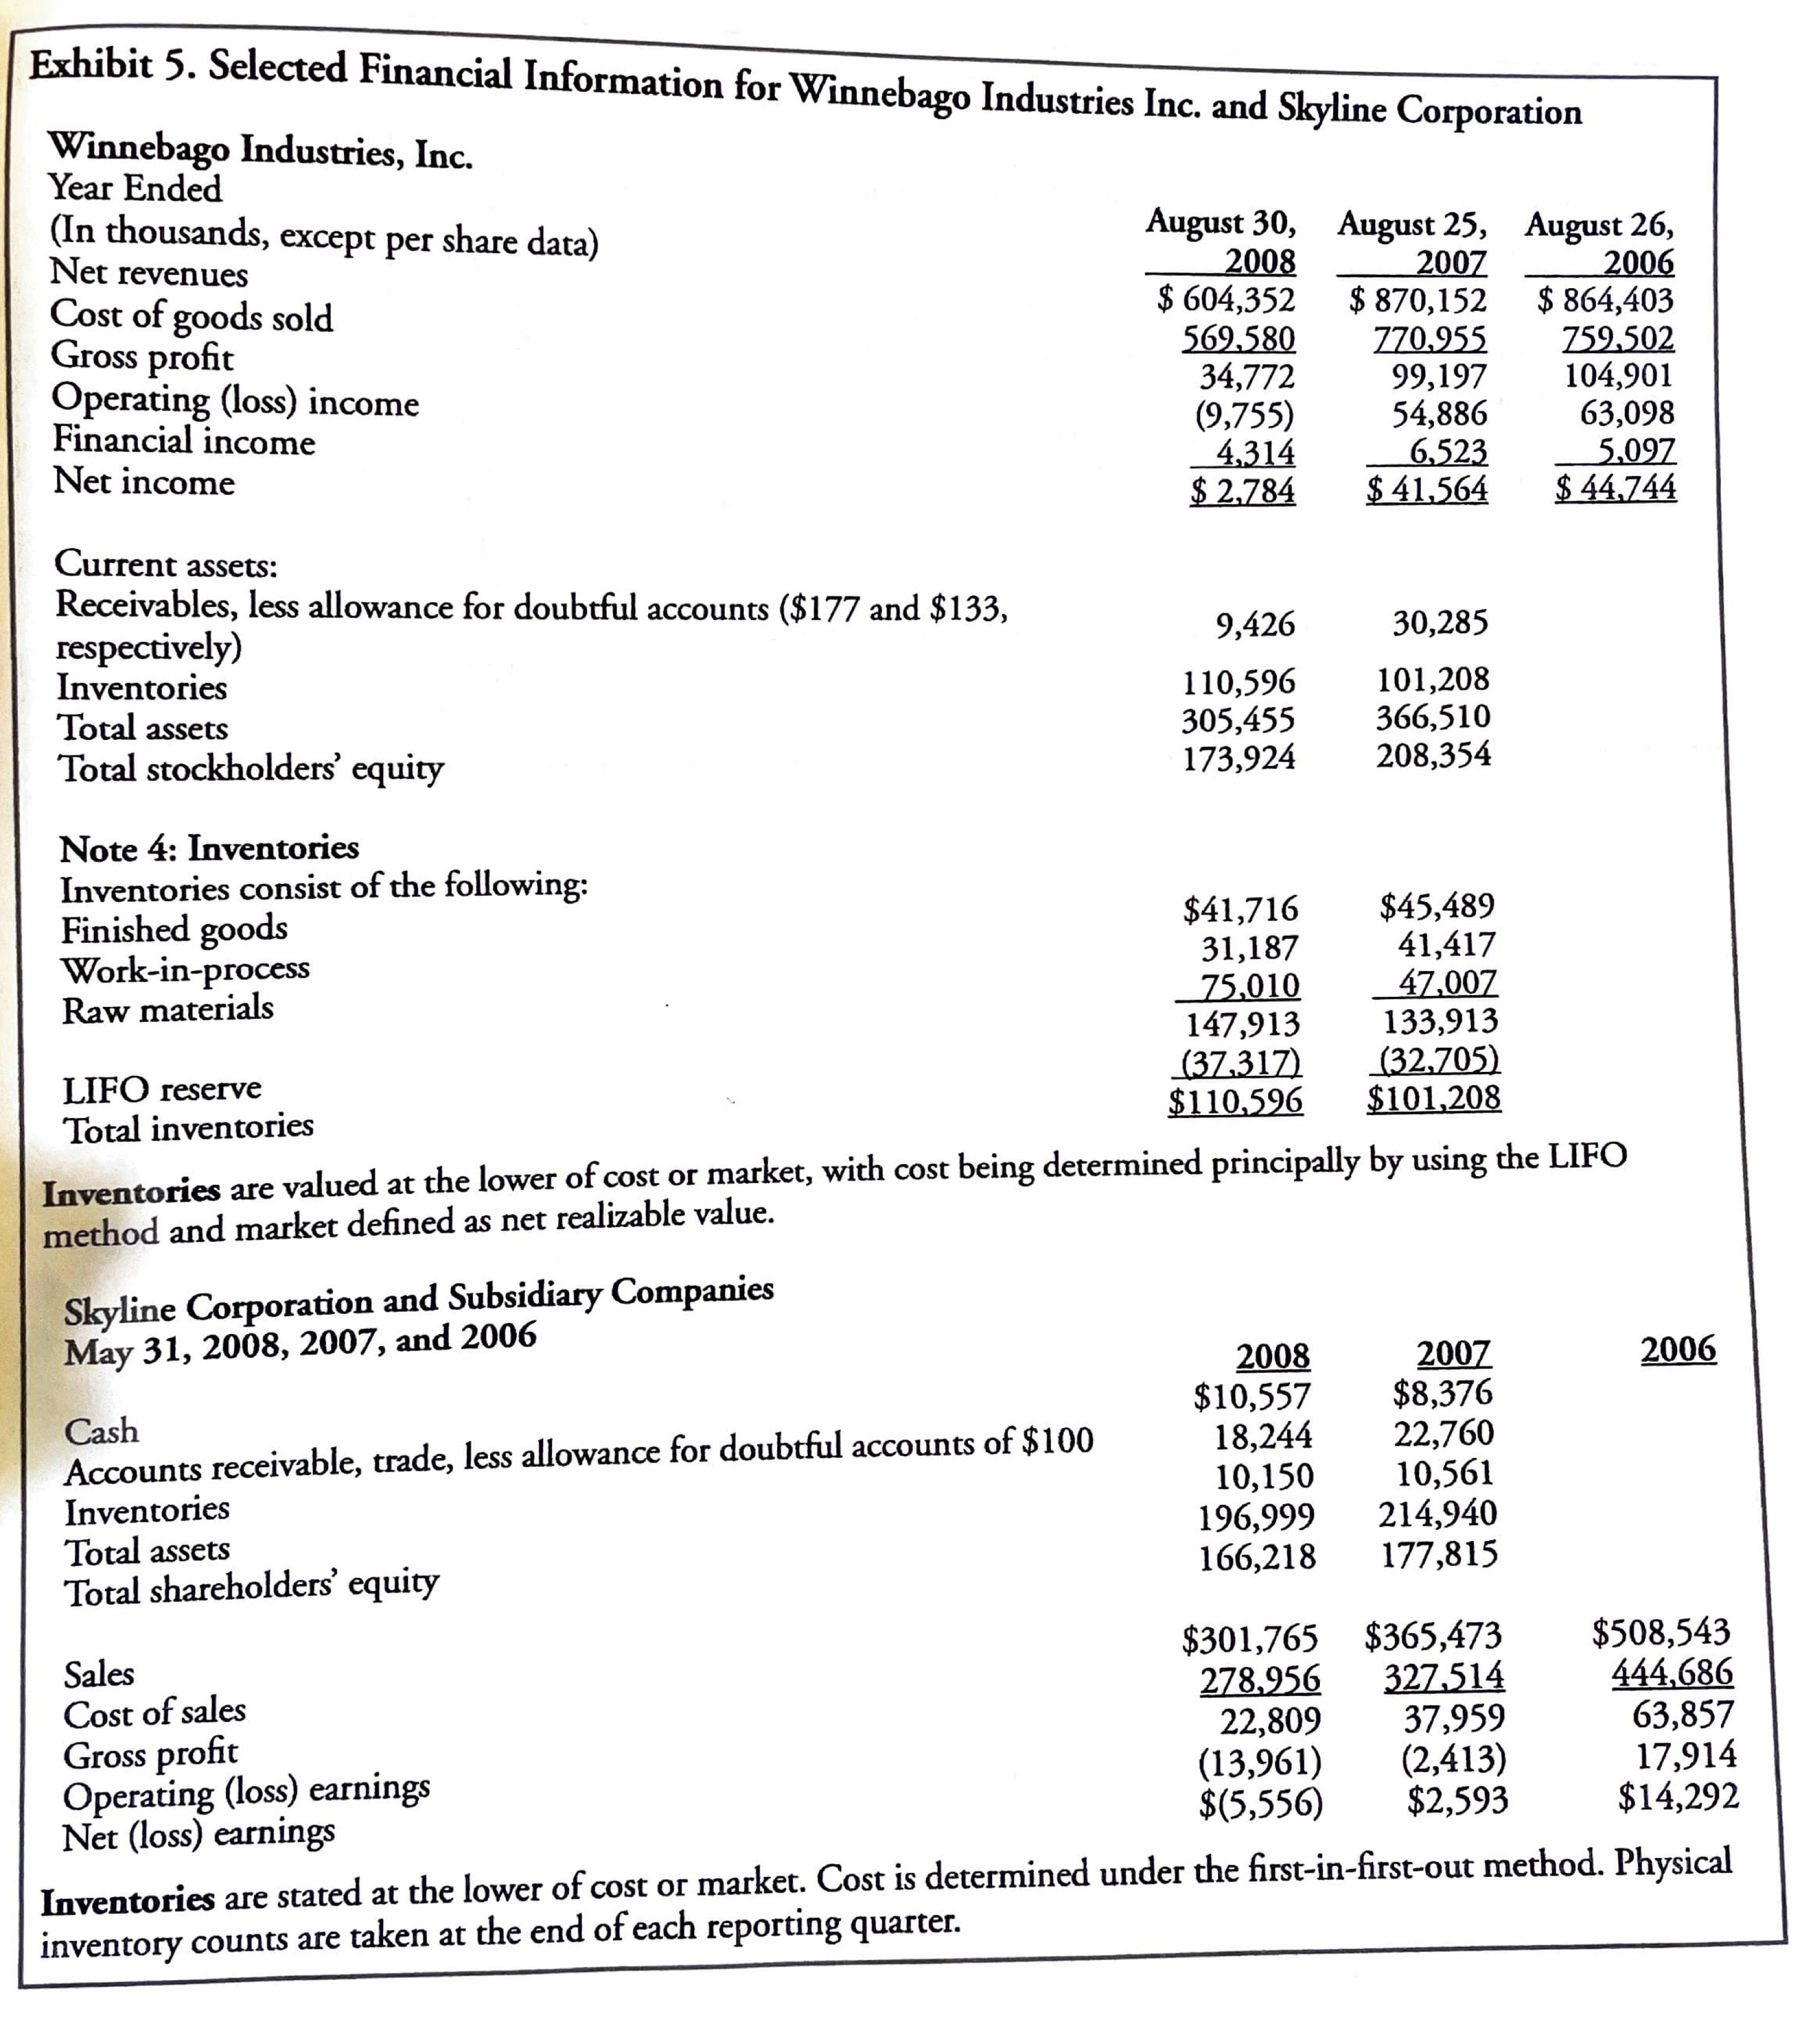
How does Thor's inventory days compare with - Winnebago? - Skyline? (Using the same method of accounting for Inventory)
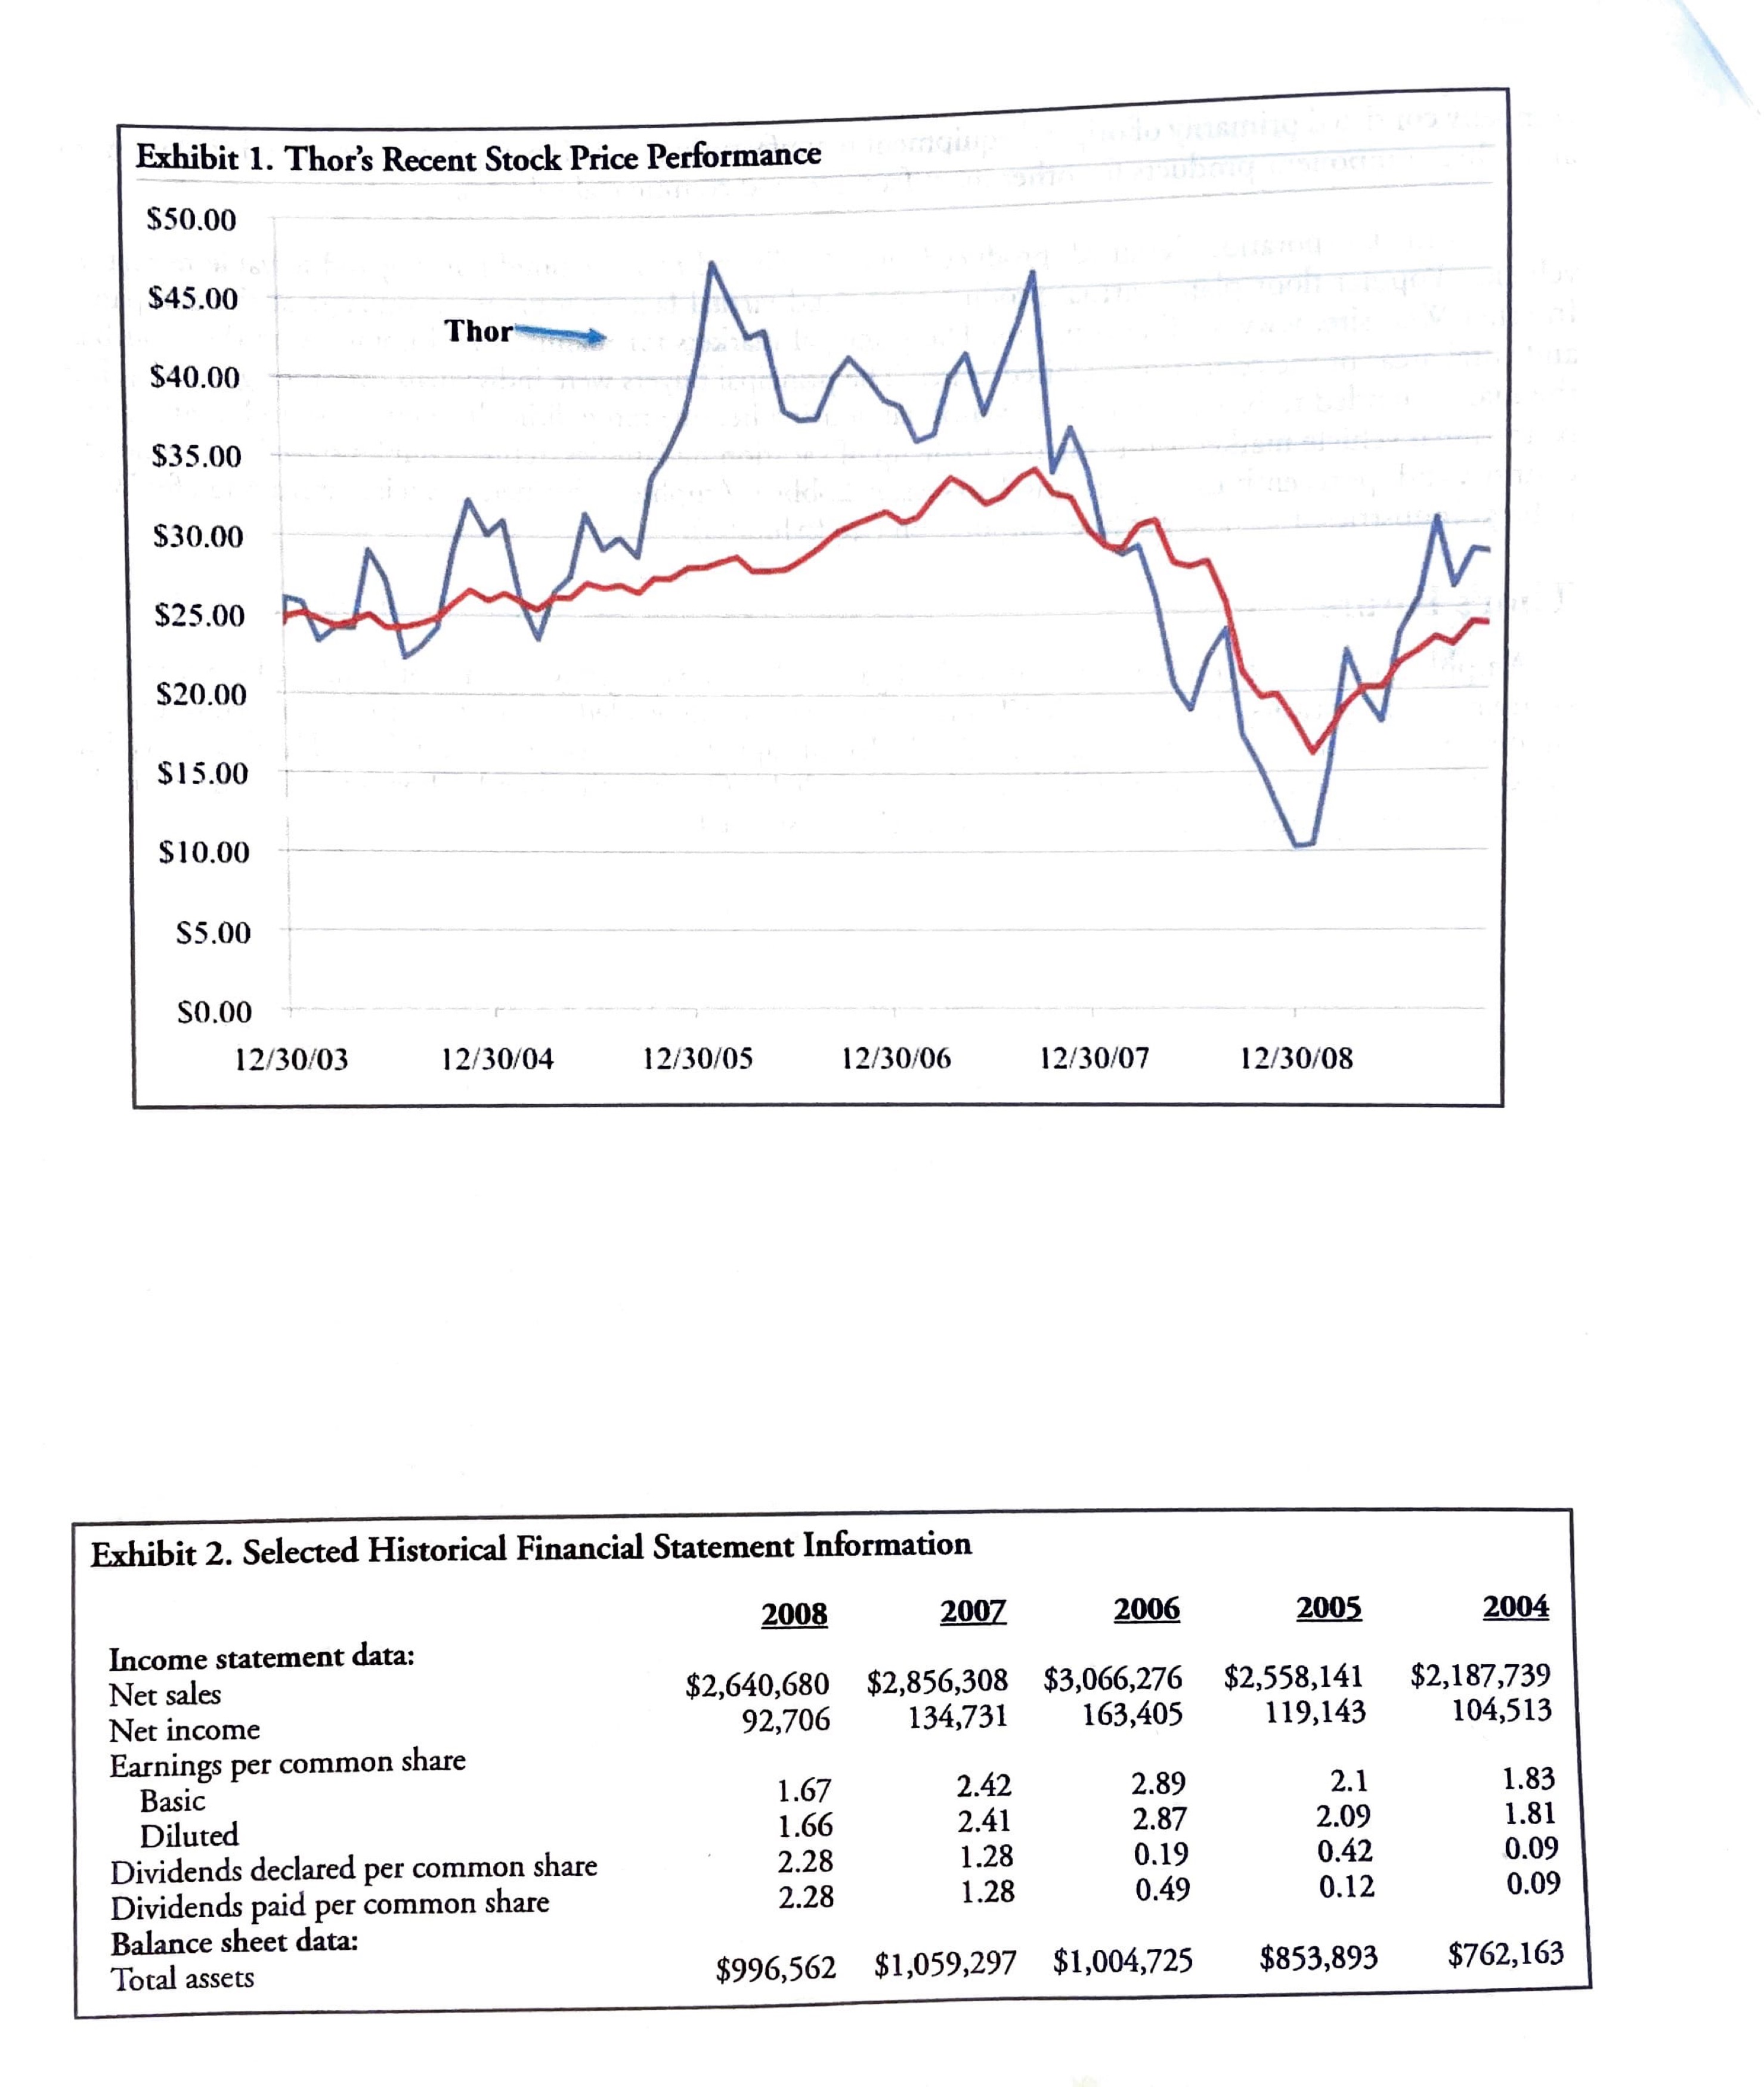
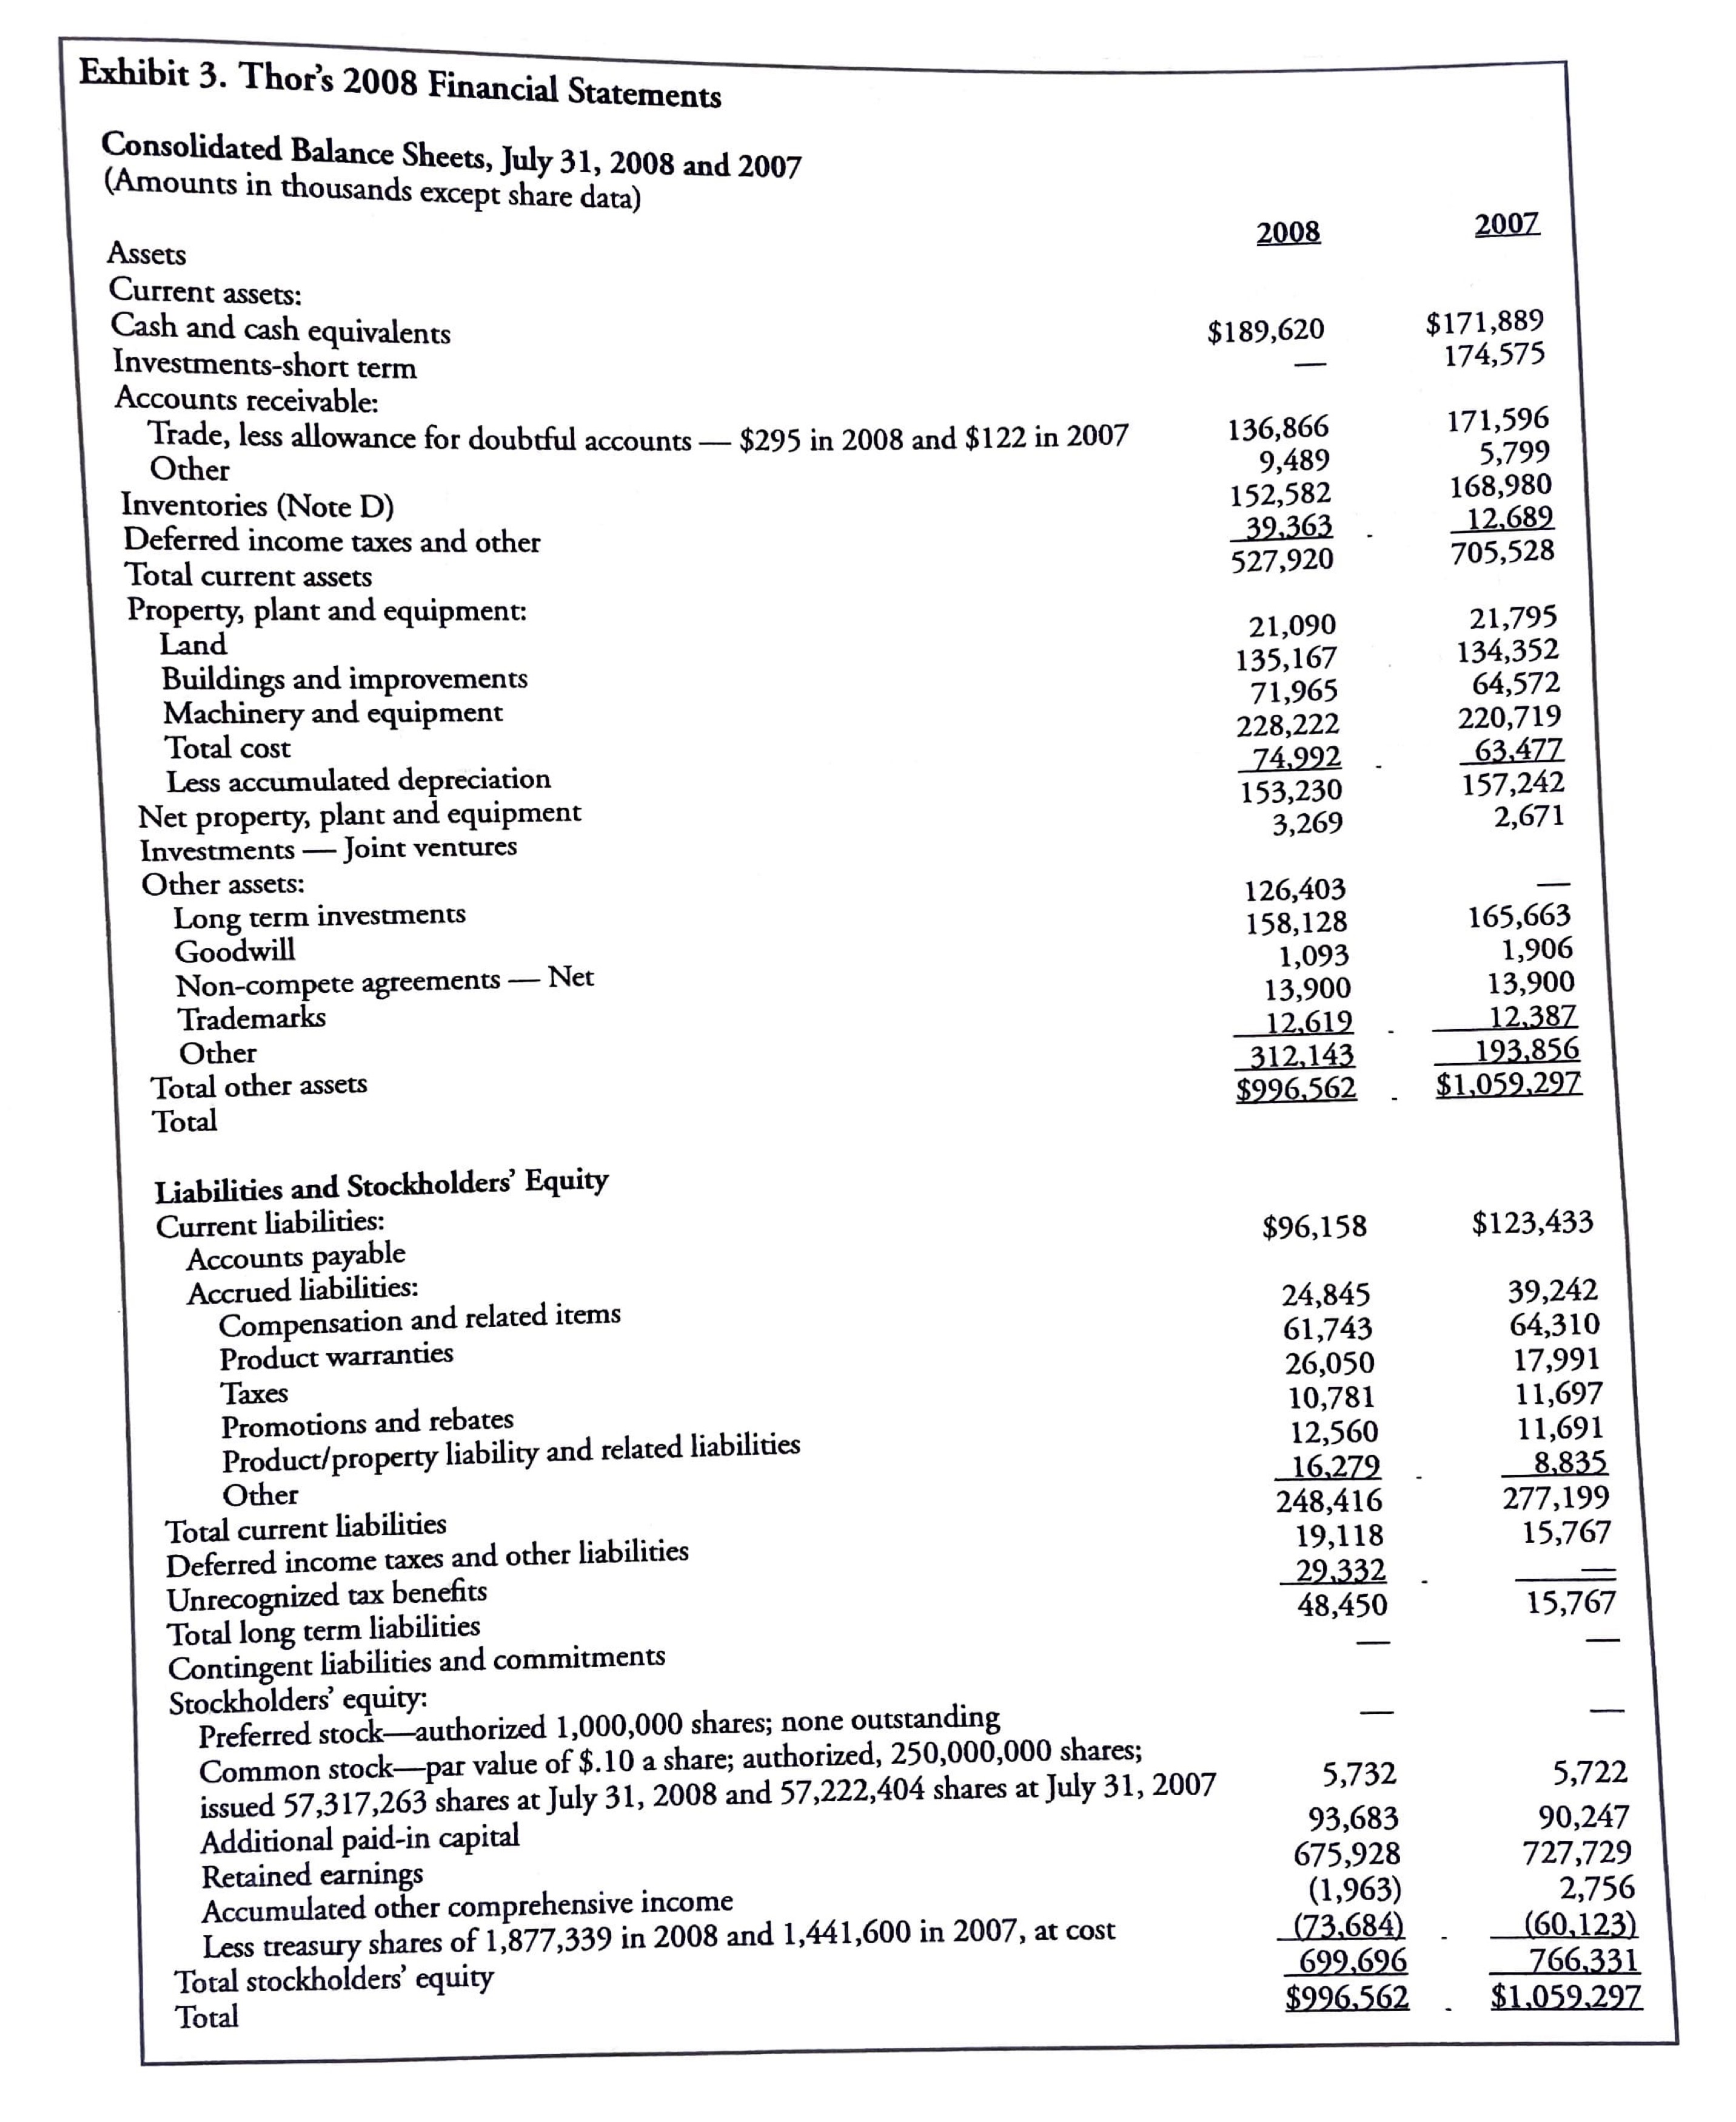
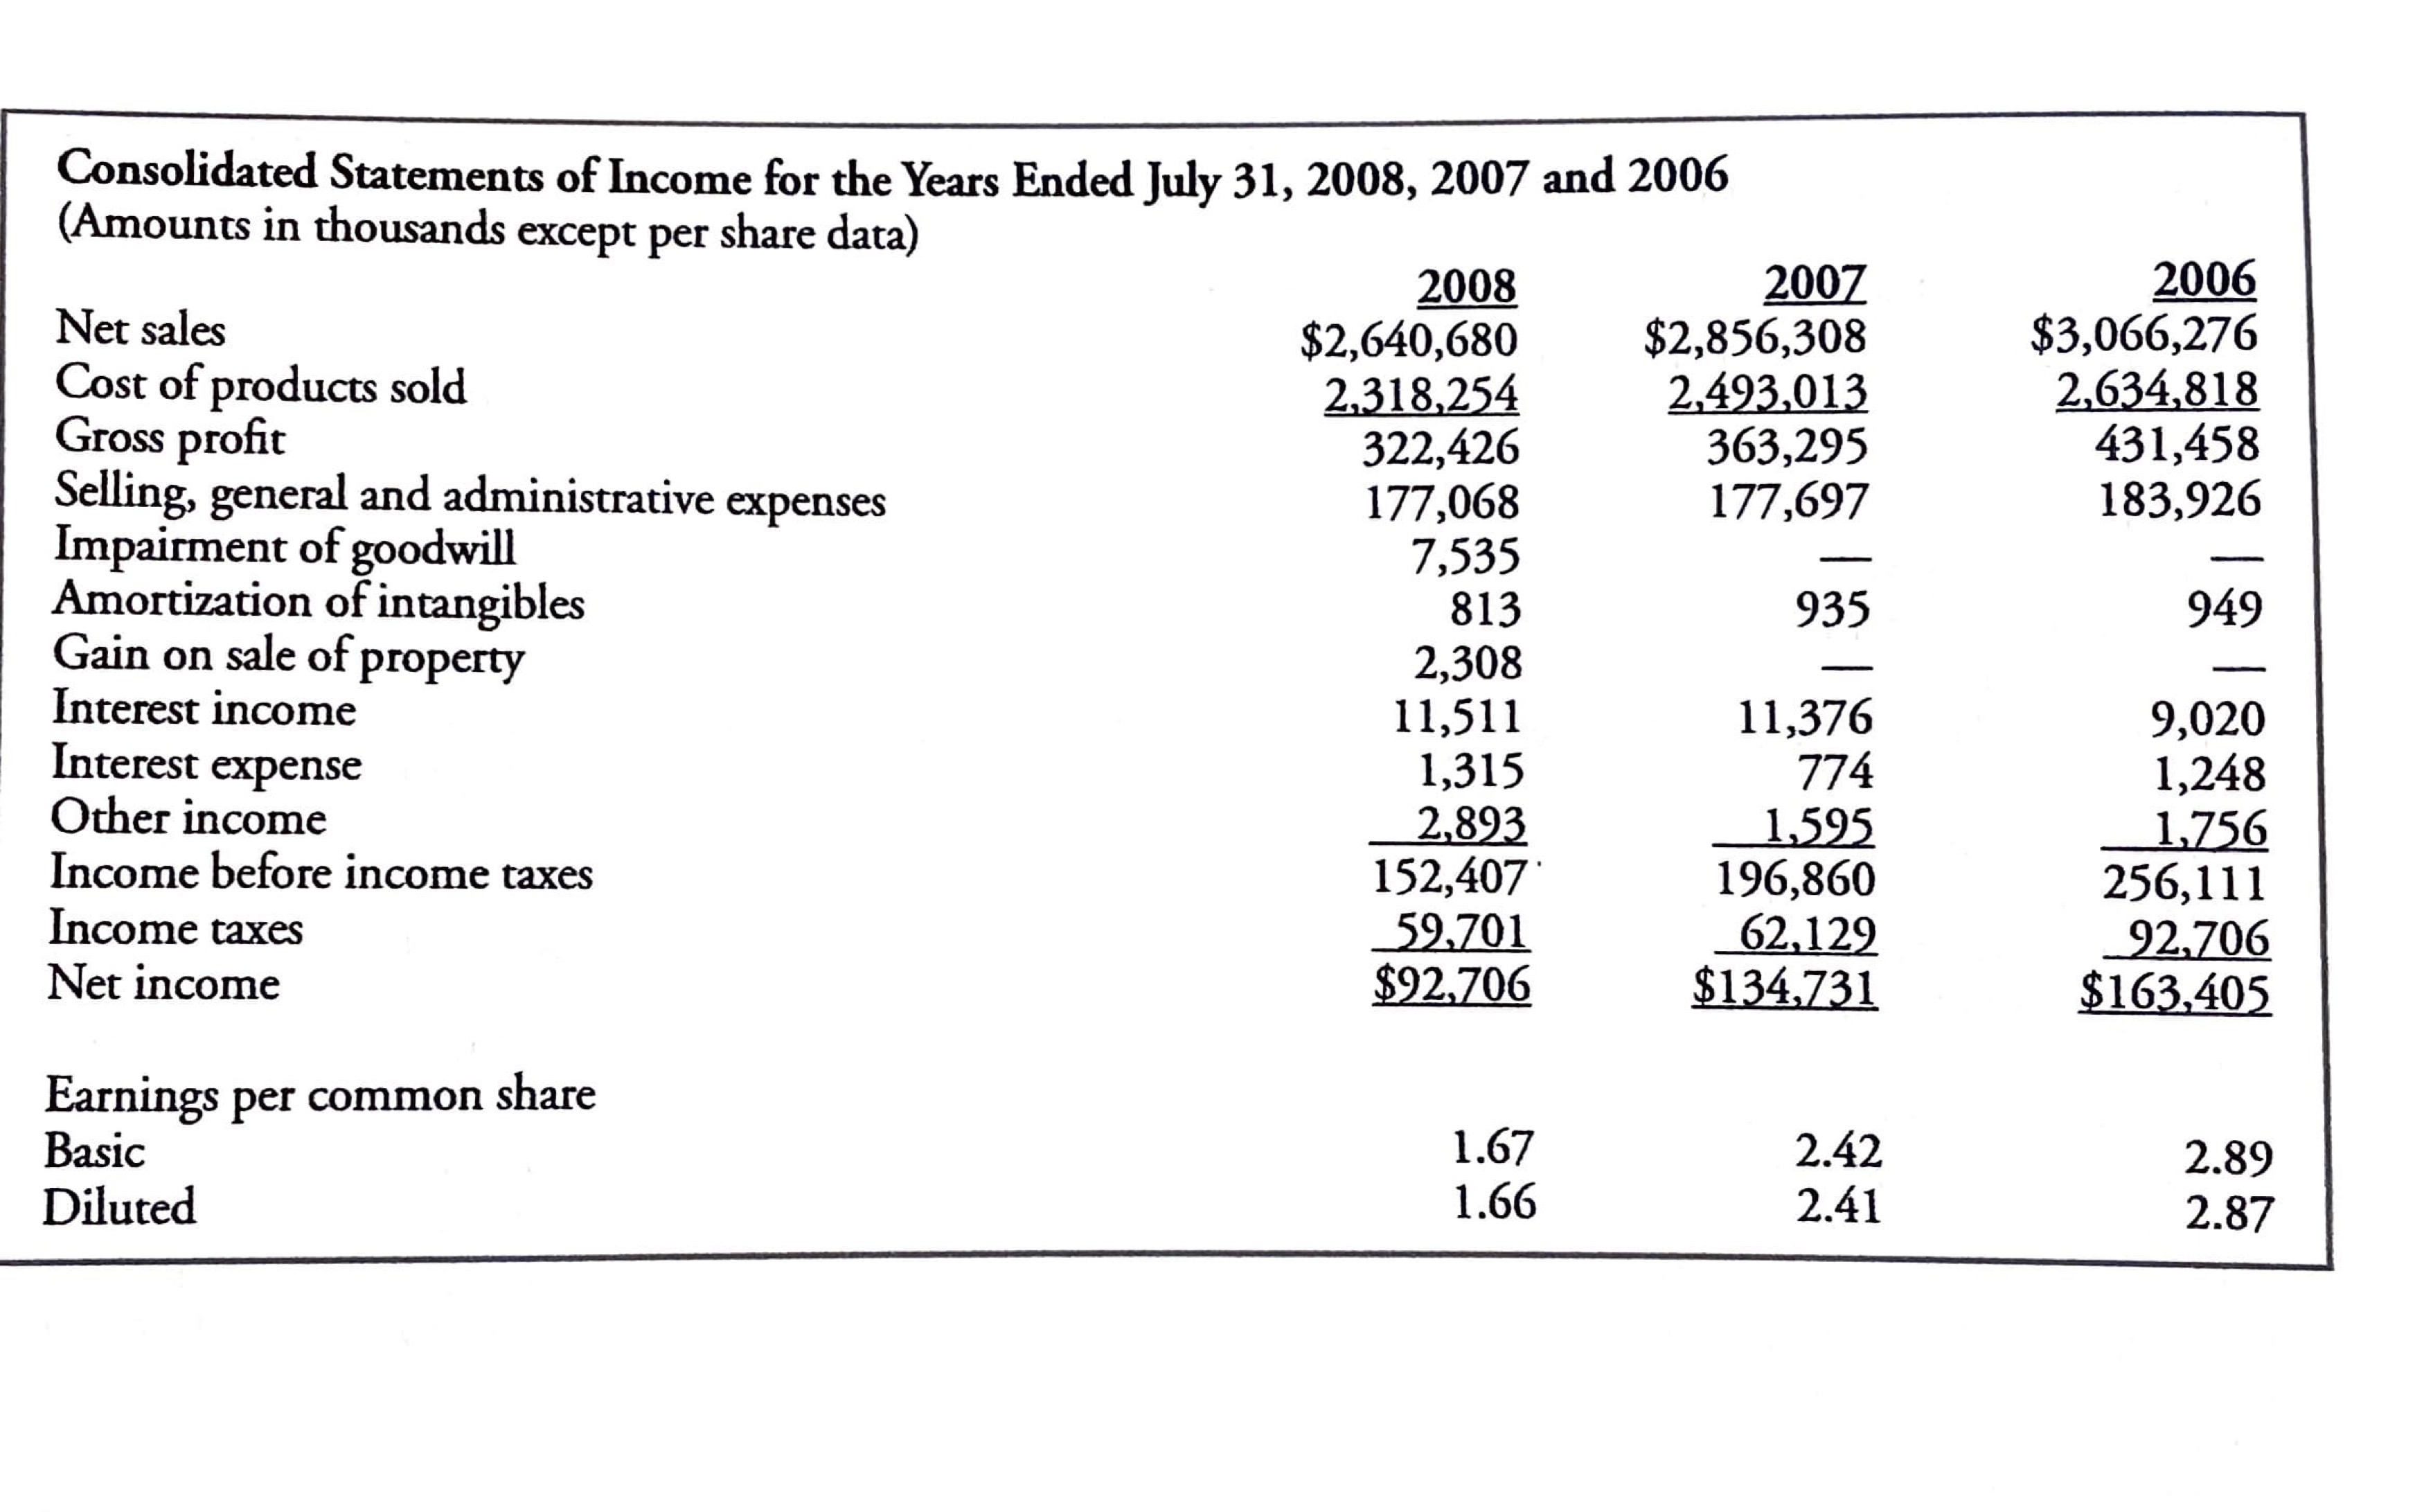
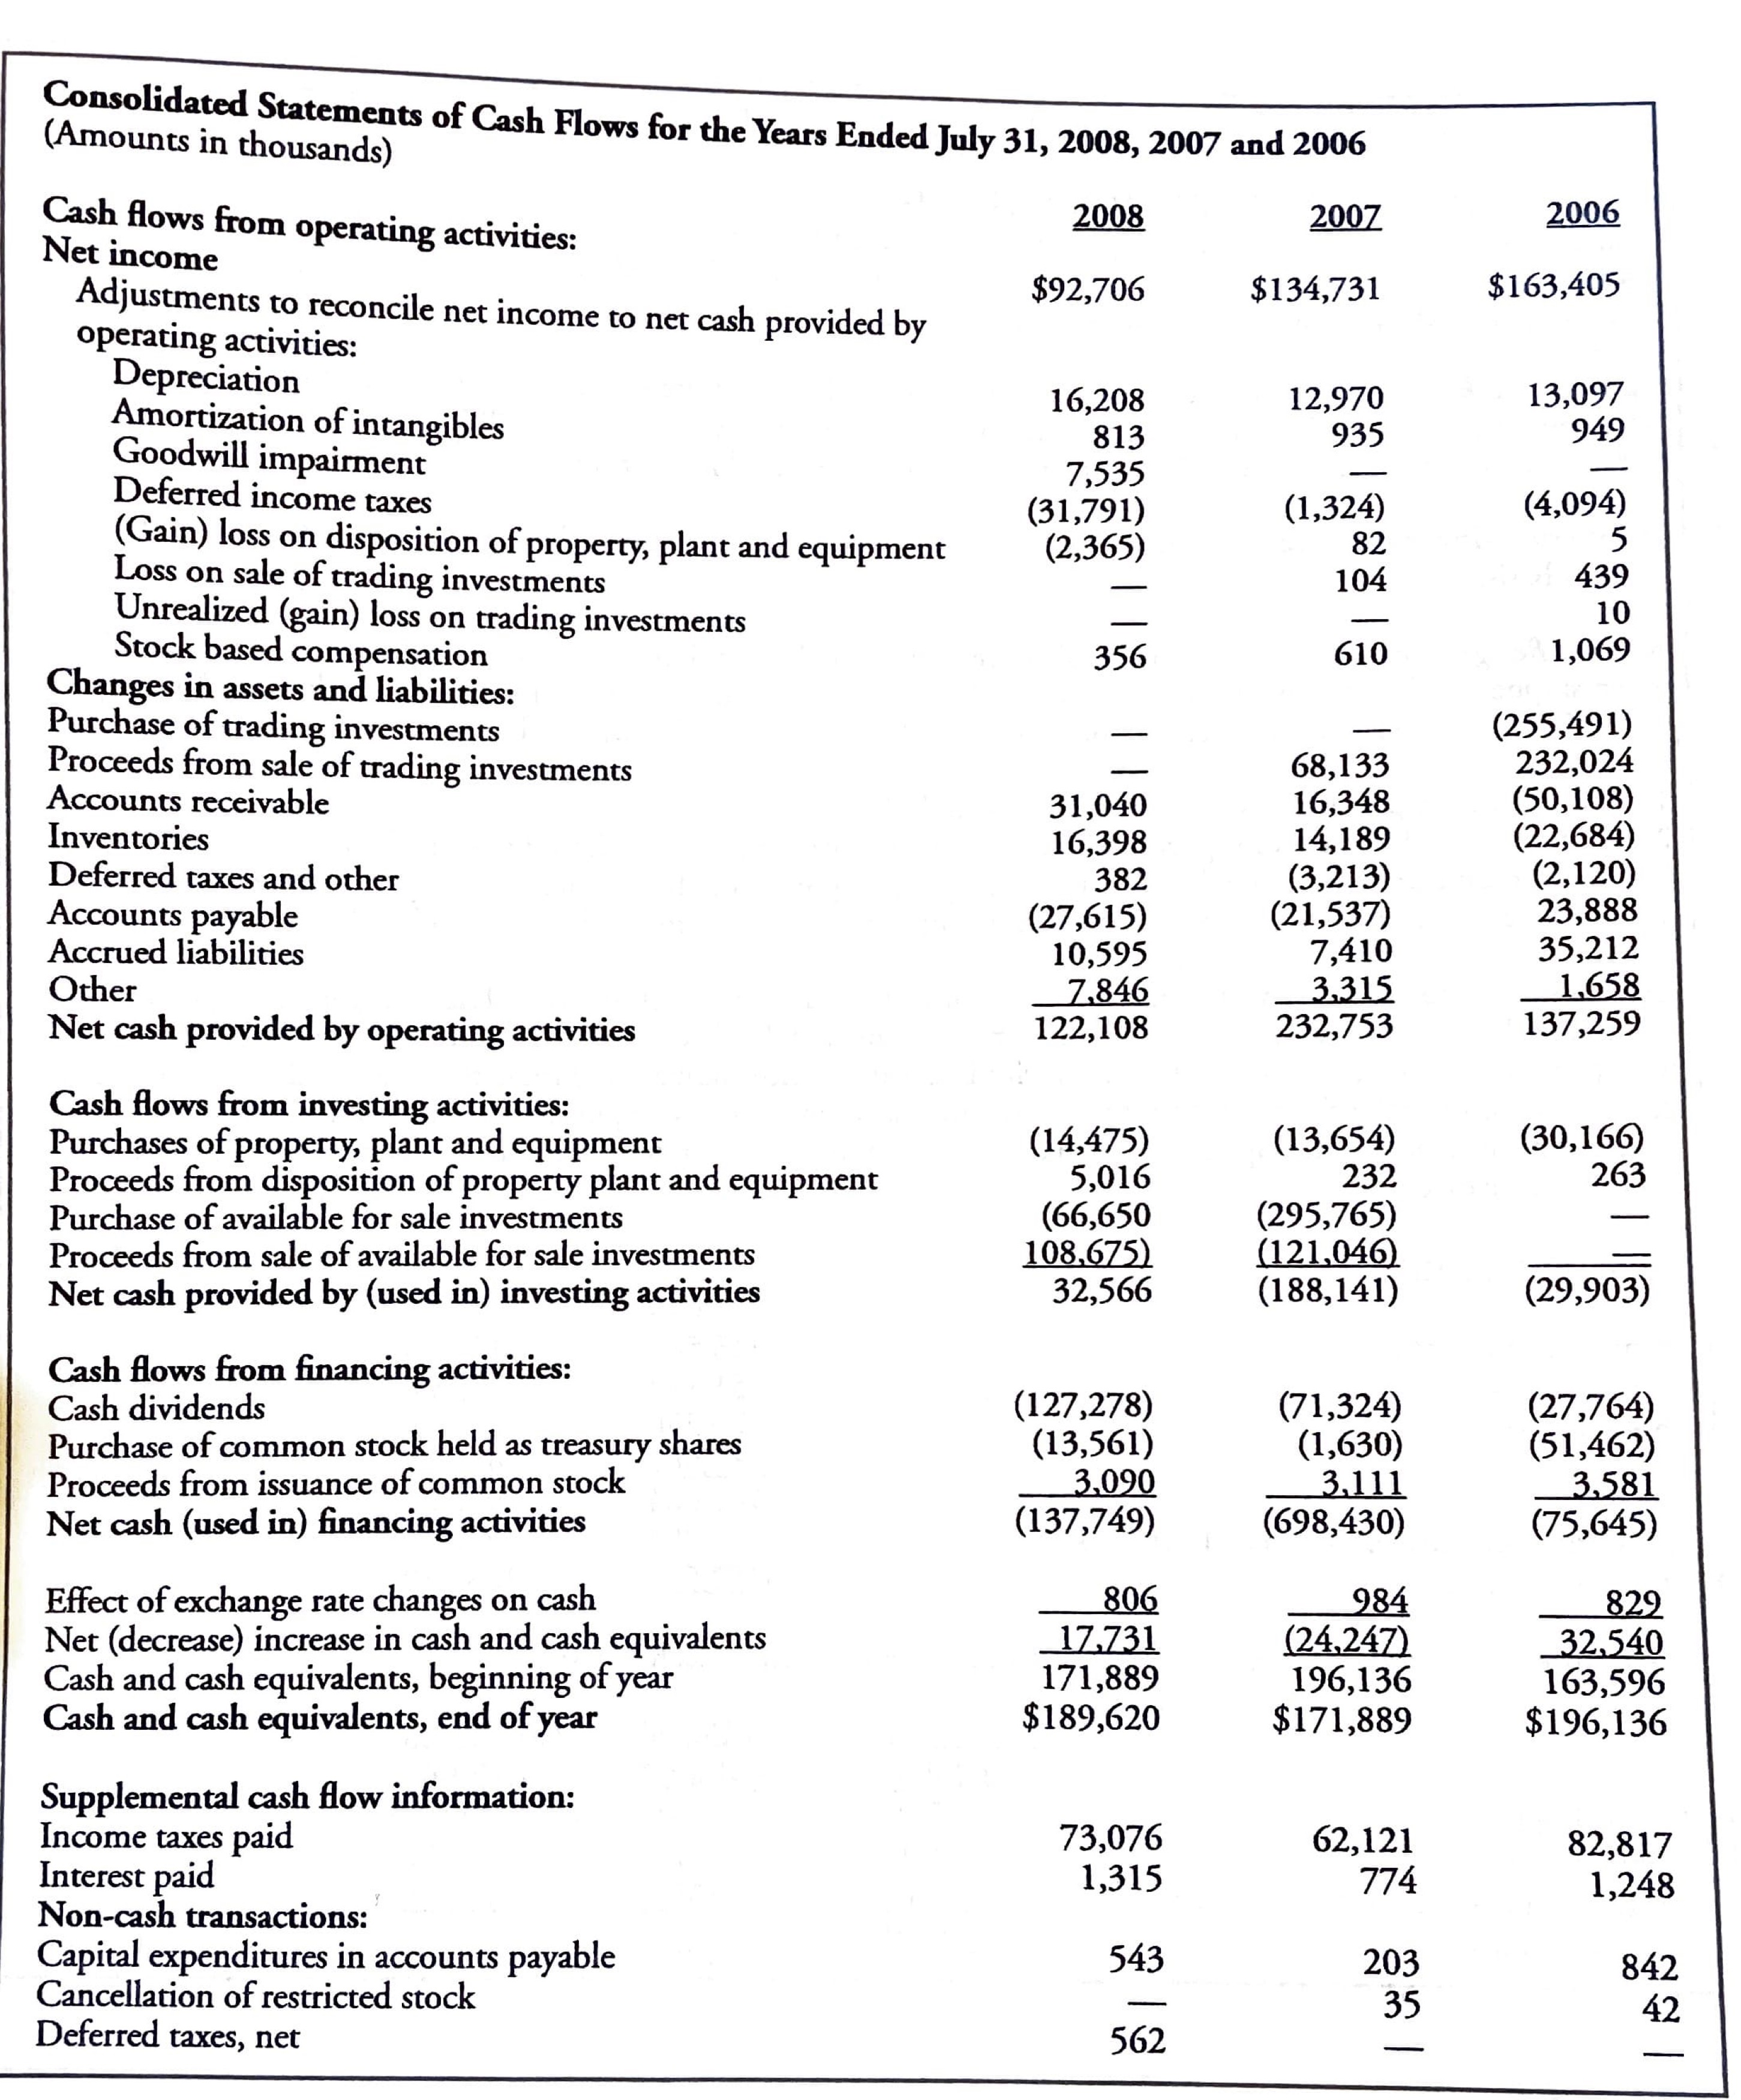
Exlglbit l. Thor's Recent Stock Price Perl'brmancer $50.00 $45.00 $40.00 $35.00 $30.00 $25.00 $20.00 $1 5.00 $10.00 $5.00 50.00 12/30/03 12/30/05 l 2/ 30/ 04 I2/30/06 12/30/07 12/30/08 Exhibit 2. Selected Historical Financial Statement Information 2M Ml M 2005 2.1.04 Income statement data: Net sales $2,640,680 $2,856,308 $3,066,276 $2,558,141 $2,187,739 Net income 92,706 134,731 163,405 119,143 104,513 Earnings per common share Basic 1.67 2.42 2.89 2.1 1.83 Diluted 1.66 2.41 2.87 2.09 1.81 Dividends declared per common share ' 2.28 1.23 0.19 0.42 0.09 Dividends paid per common share 2.28 1.28 0.49 0.12 0.09 Balance sheet data: Total assets $996,562 $1,059,297 $1,004,725 $853,893 $762,163 Exhibit 3. Thor's 2008 Financial Statements Cash and cash equivalents Investmentsshort term Amounts receivable: Trade, less allowance for doubtful accounts $295 in 2008 and $122 in 2007 136,866 171,596 O'he', 9,489 5,799 Inventories (Note D) 152,582 168.980 Deferred Income taxes and other .3216?! . 12,682 Total current assets 527,920 705,528 Pm plant and equipment. 21 9o 21 795 ,0 , Buildings and improvements 135,167 121352 Machinery and equipment 71 ,965 ,572 Total cosr 228,222 2260.219 Lees accumulated depreciation Zl . ._3.:_ZZ Net property, plant and equipment 153,230 157,242 Investments Joint ventures 3,269 2,671 Other assets: Long term invesunenrs $3,133 165 663 Goodwill , 1 Noncompete agreements Net 1,093 1,906 Trademarks 13,900 13,900 Other 421619 . __1__.3_81 Total other assets M M Total W . W liabilities and Stockholders' Equity Current liabilities: Accounts payable $96, 1 58 $1 23,433 Accrued liabilities: Compensation and related items 24,845 39,242 Product warranties 61.743 64,310 Taxes 26,050 17,991 Prometions and rebates 10,781 1 1,697 Product/ property liability and related liabilities 12,560 1 1,69 1 Other 16,222 _ 8,3225 Total current liabilities 248,416 277,199 Deferred income taxes and other liabilities 19,1 18 15,767 Unrecognized tax benets 22,332 _ _ Total long term liabilities 48,450 15,767 Contingent liabilities and commitments _. _ Stockbolders' equity: Preferred stockauthorized 1,000,000 shares; none outstanding ._ _ Common stockpar value of $.10 a share; authorized, 250,000,000 shares; issued 57,317,263 shares at July 31, 2008 and 57,222,404 shares at July 31, 2007 5,732 5,722 Additional paidin capital 93,683 90,247 Retained earnings 675,928 727,729 Accumulated other comprehensive income (1,963) 2,756 Less treasury shares of 1,877,339 in 2008 and 1,441,600 in 2007, at cost 42.16%) _ (59 123) Toral stockholders' equity 622,626 Z,] Total W2- W Consolidated Statements of Income for the Years Ended July 31, 2008, 2007 and 2006 (Amounts in thousands except per share data) 2008 2007 2006 Net sales $2,640,680 $2,856,308 $3,066,276 Cost of products sold 2,318,254 2,493,013 2,634,818 Gross profit 322,426 363,295 431,458 Selling, general and administrative expenses 177,068 177,697 183,926 Impairment of goodwill 7,535 Amortization of intangibles 813 935 949 Gain on sale of property 2,308 Interest income 11,511 11,376 9,020 Interest expense 1,315 774 1,248 Other income 2,893 1,595 1,756 Income before income taxes 152,407 196,860 256,111 Income taxes 59,701 62,129 92,706 Net income $92,706 $134,731 $163,405 Earnings per common share Basic 1.67 2.42 2.89 Diluted 1.66 2.41 2.87Consolidated 3mm, (Amounts in thousands)\" 0f Cash Flows for the Years Ended July 31, 2008, 2007 and 2006 Cash ows fro ' ' ' ' Net income m operating actmues: Adjustments to reconcile net in operating aCtivities: 23mm\" ortization of intan ibl Goodwill impairmentg 6 Deferred income taxes (Gain) loss on disposition of to Ian ' , t d Loss on sale of trading investiimriny P an equmcm Unrealized (gain) loss on trading investments Stock based compensation Changes in assets and liabilities: Purchase of trading investments Proceeds from sale of trading investments Accounts receivable Inventories Deferred taxes and other Accounts payable Accrued liabilities Other Net cash provided by operating activities Cash ows from investing activities: Purchases of property, plant and equipment Proceeds from disposition of property plant and equipment Purchase of available for sale investments Proceeds from sale of available for sale investments Net trash provided by (used in) investing activities Cash ows from nancing activities: Cash dividends Purchase of common stock held as treasury shares Proceeds from issuance of common stock Net cash (used in) nancing activities Effect of exchange rate changes on cash Net (decrease) increase in cash and cash equivalents Cash and cash equivalents, beginning ofyear Cash and cash equivalents, end ofymr Supplemental cash ow information: Income taxes paid Interest paid Non-cash transactions: I Capital expenditures in accounts payable Cancellation of restricted stock Deferred taxes, net 2008 $92,706 16,208 813 7.535 (31 ,791) (2,365) 356 31,040 16,398 382 (27,615) 10,595 2,8 122,108 (14,475) 5,016 (66,650 108,625) 32,566 (127,278) (13,561) 3,090 (137,749) _8% 12,231 171,889 $189,620 73,076 1,315 543 562 m1 $134,731 12,970 935 (1,324) 82 104 610 68,133 16,348 14,189 (3,213) (21,537) 7,410 Ji 232.753 (13,654) 232 (295,765) (Lame) (188,141) (7 1 ,324) (1,630) 3.1 11 (698,430) _9_% (24,242) 196,136 $171,889 62,121 774 203 35 2006 $163,405 13,097 949 (4,094) 5 439 10 1,069 (255,491) 232,024 (50,108) (22,684) (2,120) 23,888 35,212 1 .658 137,259 (30,166) 263 (29,903) (27,764) (51,462) 3,581 (75,645) 429 32,540 163,596 $196,136 82,817 1,248 842 42 \f\f\f
Step by Step Solution
There are 3 Steps involved in it
1 Expert Approved Answer
Step: 1 Unlock
Question Has Been Solved by an Expert!
Get step-by-step solutions from verified subject matter experts
Step: 2 Unlock
Step: 3 Unlock
Students Have Also Explored These Related Finance Questions!