

Question: How does tool e,f,g contribute to managing quality? please, explain one by one. V FIGURE 6.6 Seven Tools of TOM Tools for Generating Ideas (a)
How does tool e,f,g contribute to managing quality? please, explain one by one.
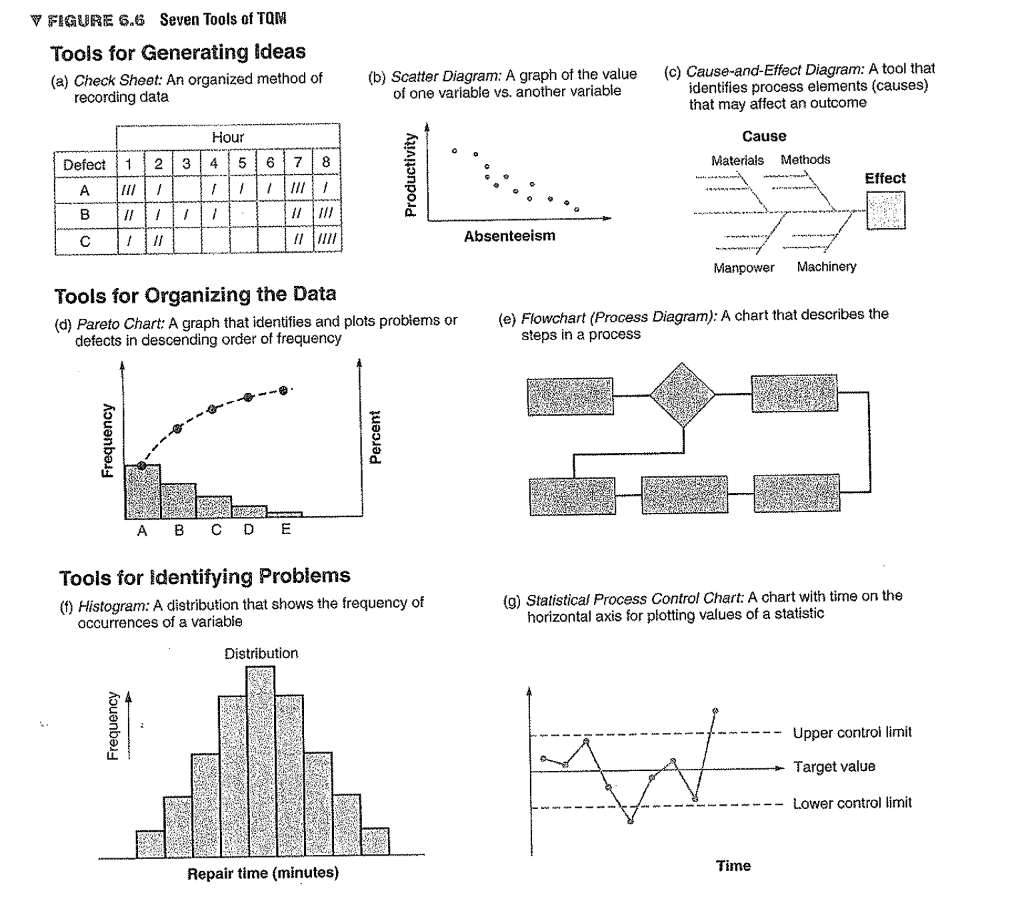
V FIGURE 6.6 Seven Tools of TOM Tools for Generating Ideas (a) Check Sheet: An organized method of recording data (b) Scatter Diagram: A graph of the value of one variable vs. another variable (c) Cause-and-Effect Diagram: A tool that identifies process elements (causes) that may affect an outcome Hour 23 4 5167 Cause Materials Methods Defect 1 8 Productivity Effect A B 11 Absenteeism Manpower Machinery Tools for Organizing the Data (d) Pareto Chart: A graph that identifies and plots problems or defects in descending order of frequency (e) Flowchart (Process Diagram): A chart that describes the steps in a process Frequency Percent A B C D E Tools for identifying Problems (0) Histogram: A distribution that shows the frequency of occurrences of a variable (9) Statistical Process Control Chart: A chart with time on the horizontal axis for plotting values of a statistic Distribution Frequency Upper controllimit Target value Lower control limit Time Repair time (minutes)Step by Step Solution
There are 3 Steps involved in it
1 Expert Approved Answer
Step: 1 Unlock

Question Has Been Solved by an Expert!
Get step-by-step solutions from verified subject matter experts
Step: 2 Unlock
Step: 3 Unlock