

Question: How is data visualization used? Help only researchers to find patterns. Communicate information to a diverse audience. To communicate using large numbers. To exaggerate
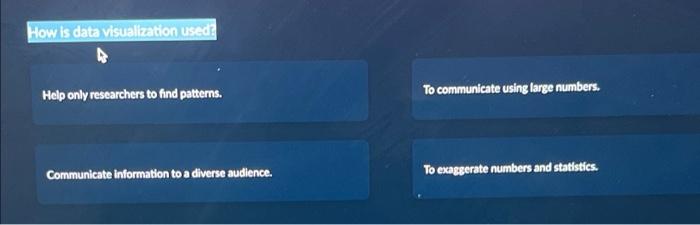
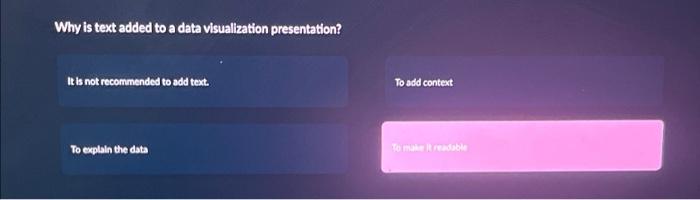
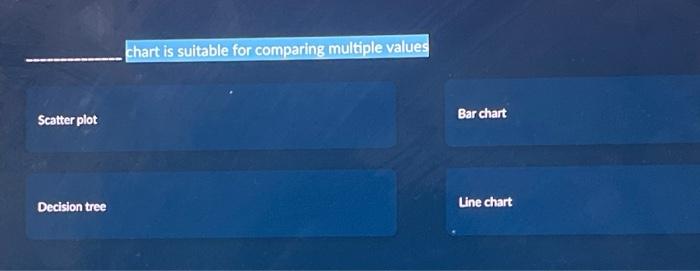
How is data visualization used? Help only researchers to find patterns. Communicate information to a diverse audience. To communicate using large numbers. To exaggerate numbers and statistics. Why is text added to a data visualization presentation? It is not recommended to add text. To explain the data To add context To make it readable Scatter plot Decision tree chart is suitable for comparing multiple values Bar chart Line chart
Step by Step Solution
3.42 Rating (149 Votes )
There are 3 Steps involved in it
Answer 1 Communicate information to a diverse audience 2 To ma... View full answer

Get step-by-step solutions from verified subject matter experts