

Question: How is Flow thru calculated, why it is important, and which of the Actual results on the 3 tabs is far superior and why Flow
How is Flow thru calculated, why it is important, and which of the Actual results on the 3 tabs is far superior and why
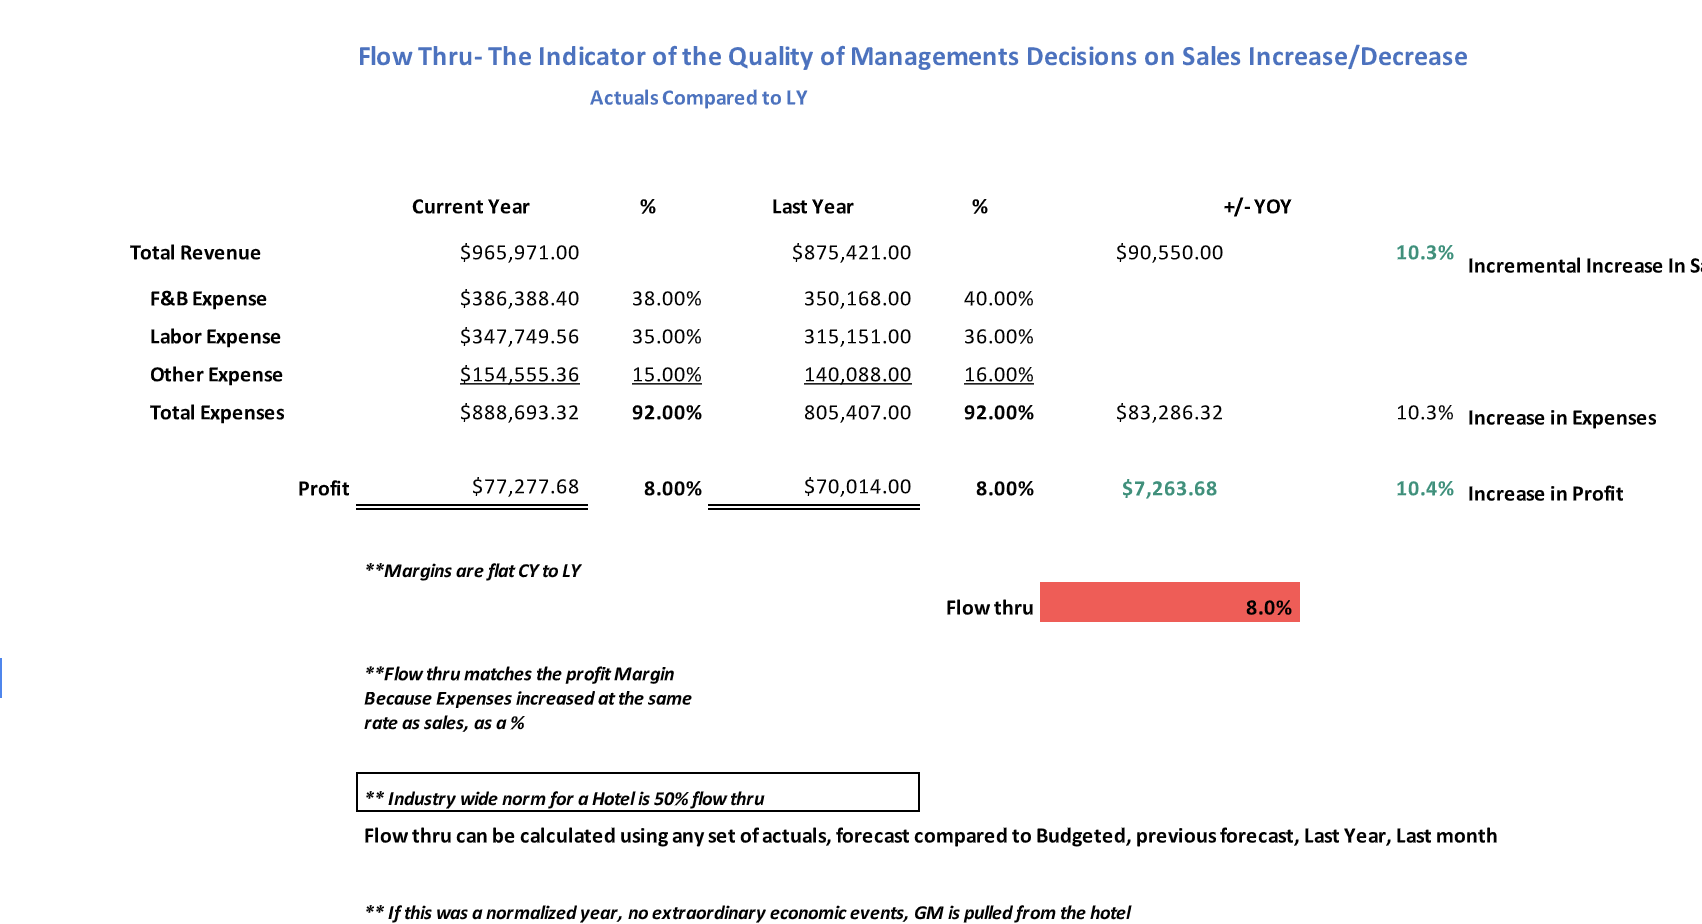
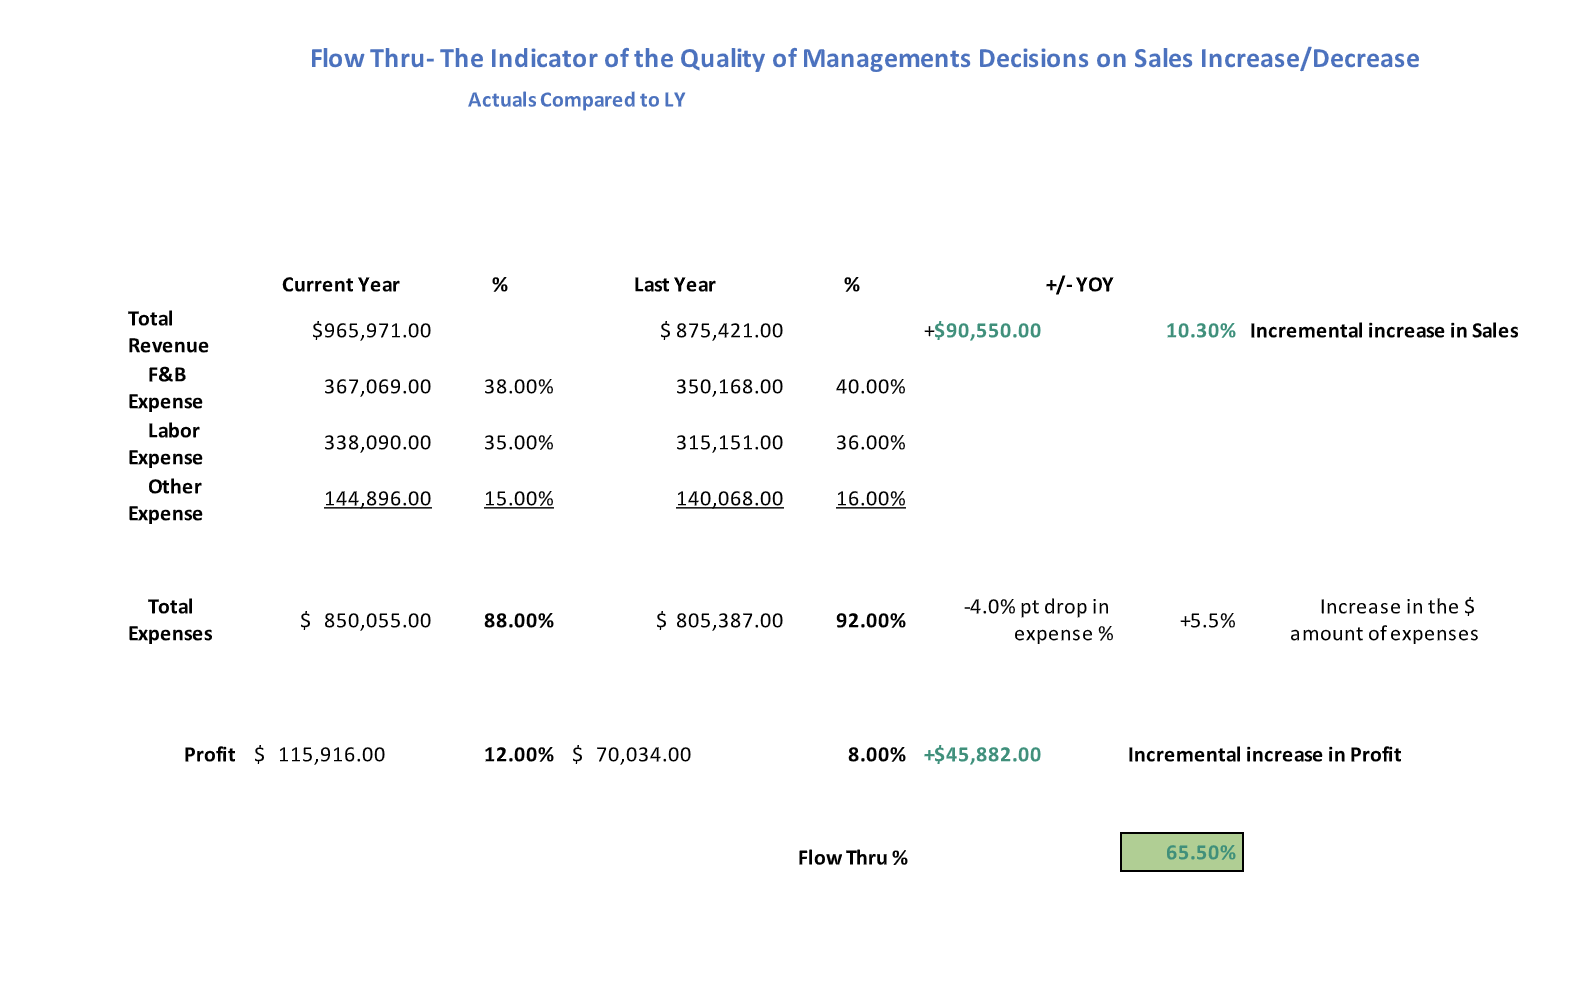
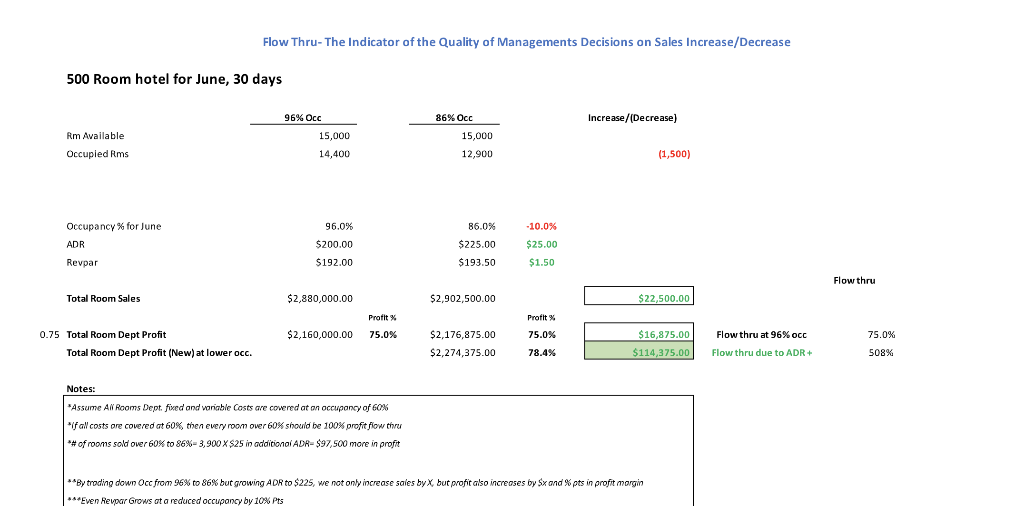
Flow Thru- The Indicator of the Quality of Managements Decisions on Sales Increase/Decrease Actuals Compared to LY Current Year % Last Year % +/-YOY Total Revenue $965,971.00 $875,421.00 $90,550.00 10.3% Incremental Increase In S 38.00% 40.00% $386,388.40 $347,749.56 350,168.00 315,151.00 35.00% 36.00% F&B Expense Labor Expense Other Expense Total Expenses $154,555.36 15.00% 140,088.00 16.00% $888,693.32 92.00% 805,407.00 92.00% $83,286.32 10.3% Increase in Expenses Profit $77,277.68 8.00% $70,014.00 8.00% $7,263.68 10.4% Increase in Profit **Margins are flat CY to LY Flow thru 8.0% **Flow thru matches the profit Margin Because Expenses increased at the same rate as sales, as a % ** Industry wide norm for a Hotel is 50% flow thru Flow thru can be calculated using any set of actuals, forecast compared to Budgeted, previous forecast, Last Year, Last month ** If this was a normalized year, no extraordinary economic events, GM is pulled from the hotel Flow Thru- The Indicator of the Quality of Managements Decisions on Sales Increase/Decrease Actuals Compared to LY Current Year % Last Year % +/-YOY $965,971.00 $ 875,421.00 +$ 90,550.00 10.30% Incremental increase in Sales 367,069.00 38.00% 350,168.00 40.00% Total Revenue F&B Expense Labor Expense Other Expense 338,090.00 35.00% 315,151.00 36.00% 144,896.00 15.00% 140,068.00 16.00% Total Expenses $ 850,055.00 88.00% $ 805,387.00 92.00% -4.0% pt drop in expense % +5.5% Increase in the $ amount of expenses Profit $ 115,916.00 12.00% $ 70,034.00 8.00% +$ 45,882.00 Incremental increase in Profit Flow Thru % 65.50% Flow Thru- The Indicator of the Quality of Managements Decisions on Sales Increase/Decrease 500 Room hotel for June, 30 days 96% Occ 15,000 86% Occ 15,000 Increase/(Decrease) Rm Available Occupied Rms 14,400 12,900 (1,500) Occupancy % for June 96.0% 86.0% -10.0% $25.00 ADR $200.00 $225.00 Revpar $192.00 $193.50 $1.50 Flow thru Total Room Sales $2,880,000.00 $2,902,500.00 $ 22,500.00 Profit Profit $2,160,000.00 75.0% 75.0% $16,875.00 0.75 Total Room Dept Profit Total Room Dept Profit (New) at lower occ. $2,176,875.00 $2,274,375.00 Flow thru at 96% occ Flow thru due to ADR 75.0% 508% 78.4% $114,375.00 Notes: *Assume A Rooms Dept. fixed and variable costs are covered at an occupancy of 60% *f all costs are covered at 60%, then every room over 60% should be 100% profit flow thru *#of rooms sold over 60% to 86%-3,900 X $25 in additional ADR-$97,500 more in profit ** By trading down Occ from 96% to 86% but growing ADR to $225, we not only increase sales by X but profit also increases by Sx and % pts in profit margin ***Even Revpar Grows at a reduced occupancy by 10% Pts Flow Thru- The Indicator of the Quality of Managements Decisions on Sales Increase/Decrease Actuals Compared to LY Current Year % Last Year % +/-YOY Total Revenue $965,971.00 $875,421.00 $90,550.00 10.3% Incremental Increase In S 38.00% 40.00% $386,388.40 $347,749.56 350,168.00 315,151.00 35.00% 36.00% F&B Expense Labor Expense Other Expense Total Expenses $154,555.36 15.00% 140,088.00 16.00% $888,693.32 92.00% 805,407.00 92.00% $83,286.32 10.3% Increase in Expenses Profit $77,277.68 8.00% $70,014.00 8.00% $7,263.68 10.4% Increase in Profit **Margins are flat CY to LY Flow thru 8.0% **Flow thru matches the profit Margin Because Expenses increased at the same rate as sales, as a % ** Industry wide norm for a Hotel is 50% flow thru Flow thru can be calculated using any set of actuals, forecast compared to Budgeted, previous forecast, Last Year, Last month ** If this was a normalized year, no extraordinary economic events, GM is pulled from the hotel Flow Thru- The Indicator of the Quality of Managements Decisions on Sales Increase/Decrease Actuals Compared to LY Current Year % Last Year % +/-YOY $965,971.00 $ 875,421.00 +$ 90,550.00 10.30% Incremental increase in Sales 367,069.00 38.00% 350,168.00 40.00% Total Revenue F&B Expense Labor Expense Other Expense 338,090.00 35.00% 315,151.00 36.00% 144,896.00 15.00% 140,068.00 16.00% Total Expenses $ 850,055.00 88.00% $ 805,387.00 92.00% -4.0% pt drop in expense % +5.5% Increase in the $ amount of expenses Profit $ 115,916.00 12.00% $ 70,034.00 8.00% +$ 45,882.00 Incremental increase in Profit Flow Thru % 65.50% Flow Thru- The Indicator of the Quality of Managements Decisions on Sales Increase/Decrease 500 Room hotel for June, 30 days 96% Occ 15,000 86% Occ 15,000 Increase/(Decrease) Rm Available Occupied Rms 14,400 12,900 (1,500) Occupancy % for June 96.0% 86.0% -10.0% $25.00 ADR $200.00 $225.00 Revpar $192.00 $193.50 $1.50 Flow thru Total Room Sales $2,880,000.00 $2,902,500.00 $ 22,500.00 Profit Profit $2,160,000.00 75.0% 75.0% $16,875.00 0.75 Total Room Dept Profit Total Room Dept Profit (New) at lower occ. $2,176,875.00 $2,274,375.00 Flow thru at 96% occ Flow thru due to ADR 75.0% 508% 78.4% $114,375.00 Notes: *Assume A Rooms Dept. fixed and variable costs are covered at an occupancy of 60% *f all costs are covered at 60%, then every room over 60% should be 100% profit flow thru *#of rooms sold over 60% to 86%-3,900 X $25 in additional ADR-$97,500 more in profit ** By trading down Occ from 96% to 86% but growing ADR to $225, we not only increase sales by X but profit also increases by Sx and % pts in profit margin ***Even Revpar Grows at a reduced occupancy by 10% Pts
Step by Step Solution
There are 3 Steps involved in it

Get step-by-step solutions from verified subject matter experts