

Question: How is the company performing in terms of raw numbers year over year? How do their ratios stack up against industry averages? What does the
How is the company performing in terms of raw numbers year over year? How do their ratios stack up against industry averages? What does the trend and common size analysis reveal?What recommendations would you make to management based on your financial review?
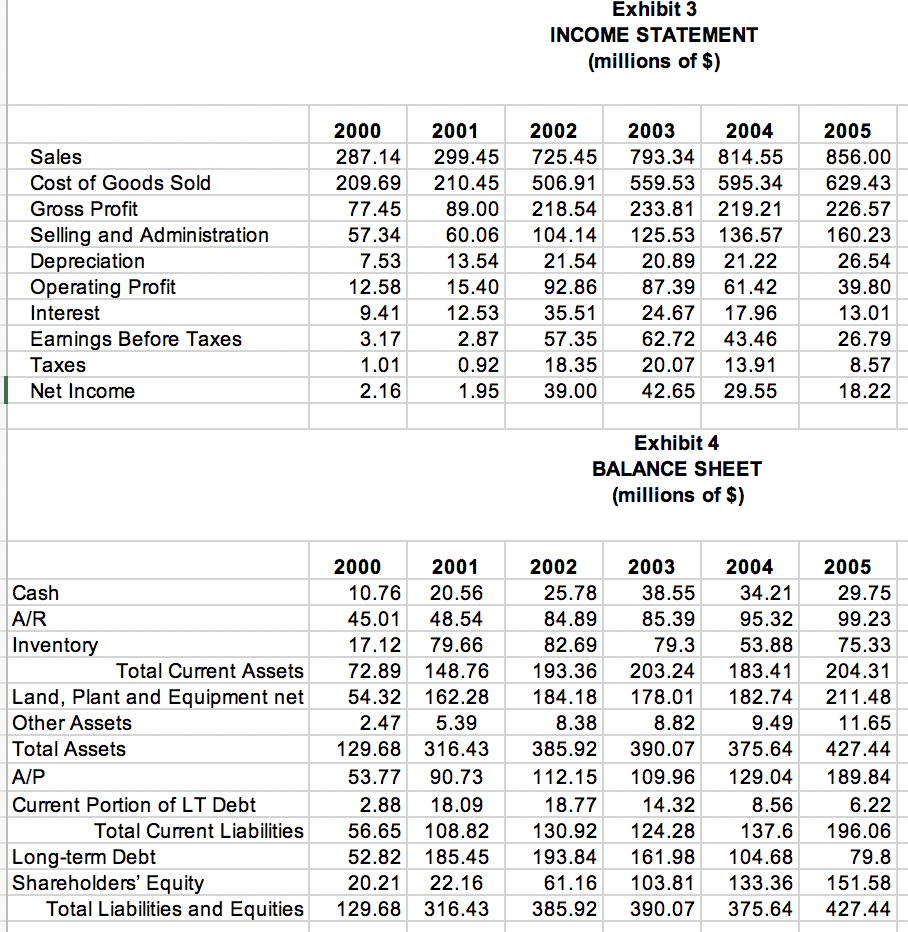
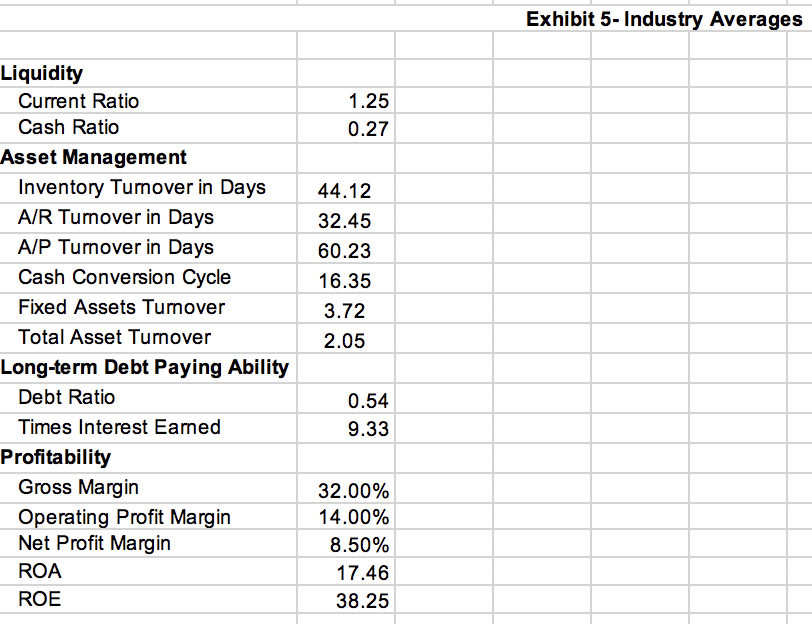
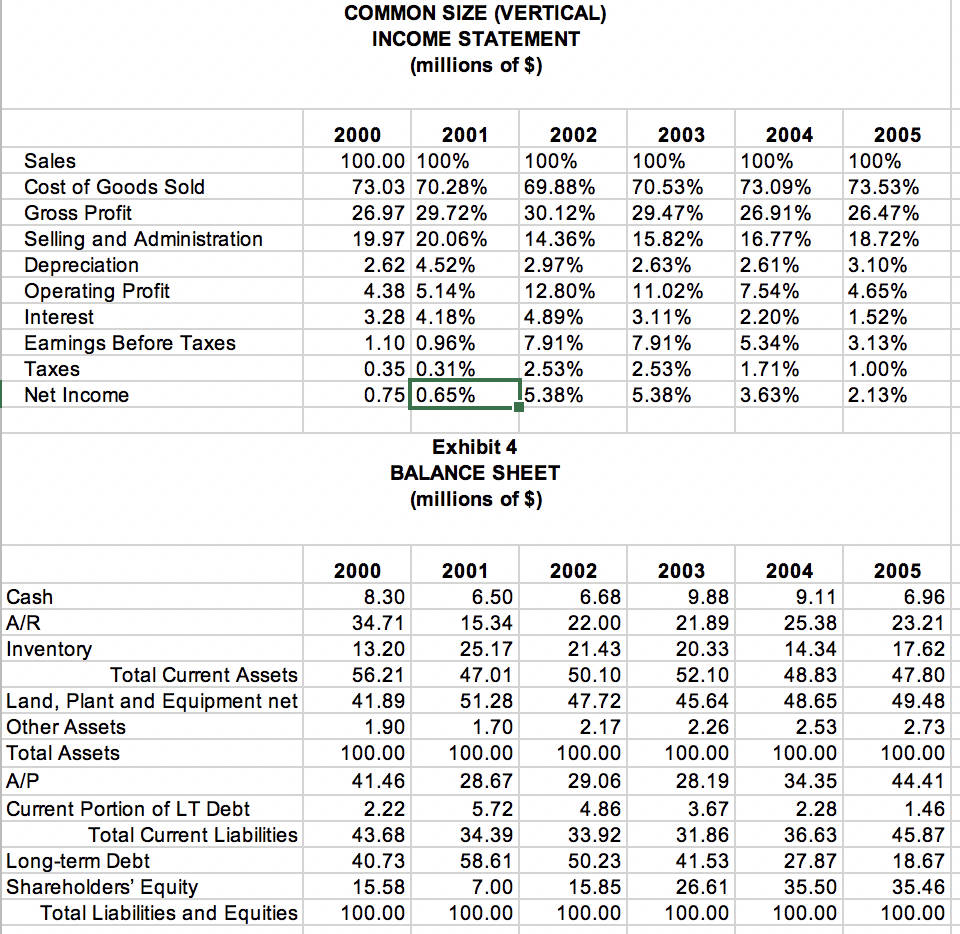
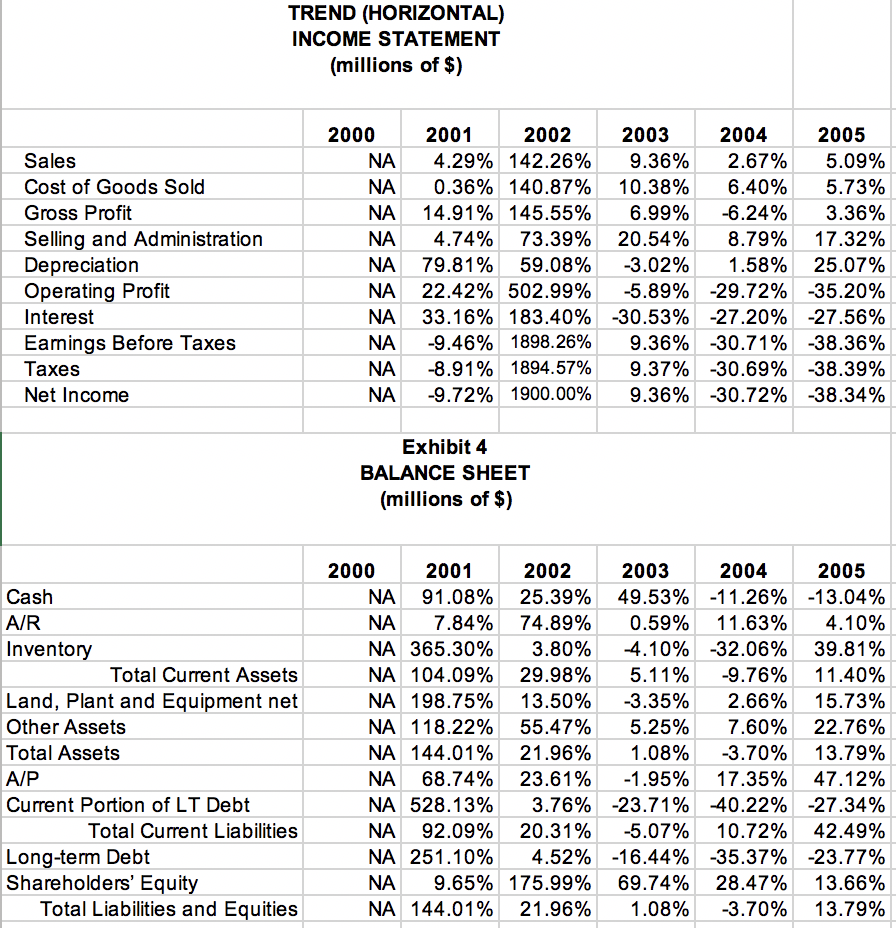
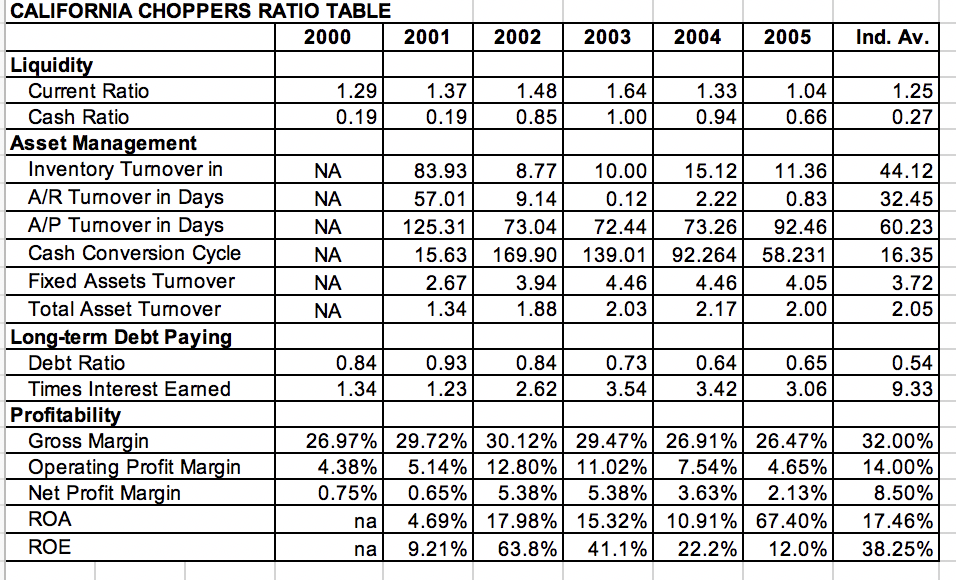
Exhibit 3 INCOME STATEMENT (millions of $) 2000 2001 2002 2003 2004 2005 Sales 287.14 299.45 725.45 793.34 814.55 856.00 Cost of Goods Sold 209.69 210.45 506.91 559.53 595.34 629.43 Gross Profit 77.45 Selling and Administration 57.34 89.00 218.54 60.06 104.14 233.81 219.21 226.57 125.53 136.57 160.23 Depreciation 7.53 13.54 21.54 20.89 21.22 26.54 Operating Profit 12.58 15.40 92.86 87.39 61.42 39.80 Interest 9.41 12.53 35.51 24.67 17.96 13.01 Earnings Before Taxes 3.17 2.87 57.35 62.72 43.46 26.79 Taxes 1.01 0.92 18.35 20.07 13.91 8.57 Net Income 2.16 1.95 39.00 42.65 29.55 18.22 Exhibit 4 BALANCE SHEET (millions of $) 2000 2001 2002 2003 2004 2005 Cash 10.76 20.56 25.78 38.55 34.21 29.75 A/R 45.01 48.54 84.89 85.39 95.32 99.23 Inventory 17.12 79.66 82.69 79.3 53.88 75.33 Total Current Assets 72.89 148.76 193.36 203.24 183.41 204.31 Land, Plant and Equipment net 54.32 162.28 184.18 178.01 182.74 211.48 Other Assets 2.47 5.39 8.38 8.82 9.49 11.65 Total Assets 129.68 316.43 385.92 390.07 375.64 427.44 A/P 53.77 90.73 112.15 109.96 129.04 189.84 Current Portion of LT Debt 2.88 18.09 18.77 14.32 8.56 6.22 Total Current Liabilities 56.65 108.82 130.92 124.28 137.6 196.06 Long-term Debt 52.82 185.45 193.84 161.98 104.68 79.8 Shareholders' Equity 20.21 22.16 61.16 103.81 133.36 151.58 Total Liabilities and Equities 129.68 316.43 385.92 390.07 375.64 427.44
Step by Step Solution
There are 3 Steps involved in it
To provide a comprehensive financial analysis of the companys performance we need to evaluate its raw numbers year over year compare its financial ratios against industry averages and conduct trend an... View full answer

Get step-by-step solutions from verified subject matter experts