

Question: . How many peaks would you expect for this distribution? c. Would you expect the distribution to be symmetric, right skewed or left skewed? d.
. How many peaks would you expect for this distribution?
c. Would you expect the distribution to be symmetric, right skewed or left skewed?
d. Would you expect the variation of the distribution to be small, moderate, or large?
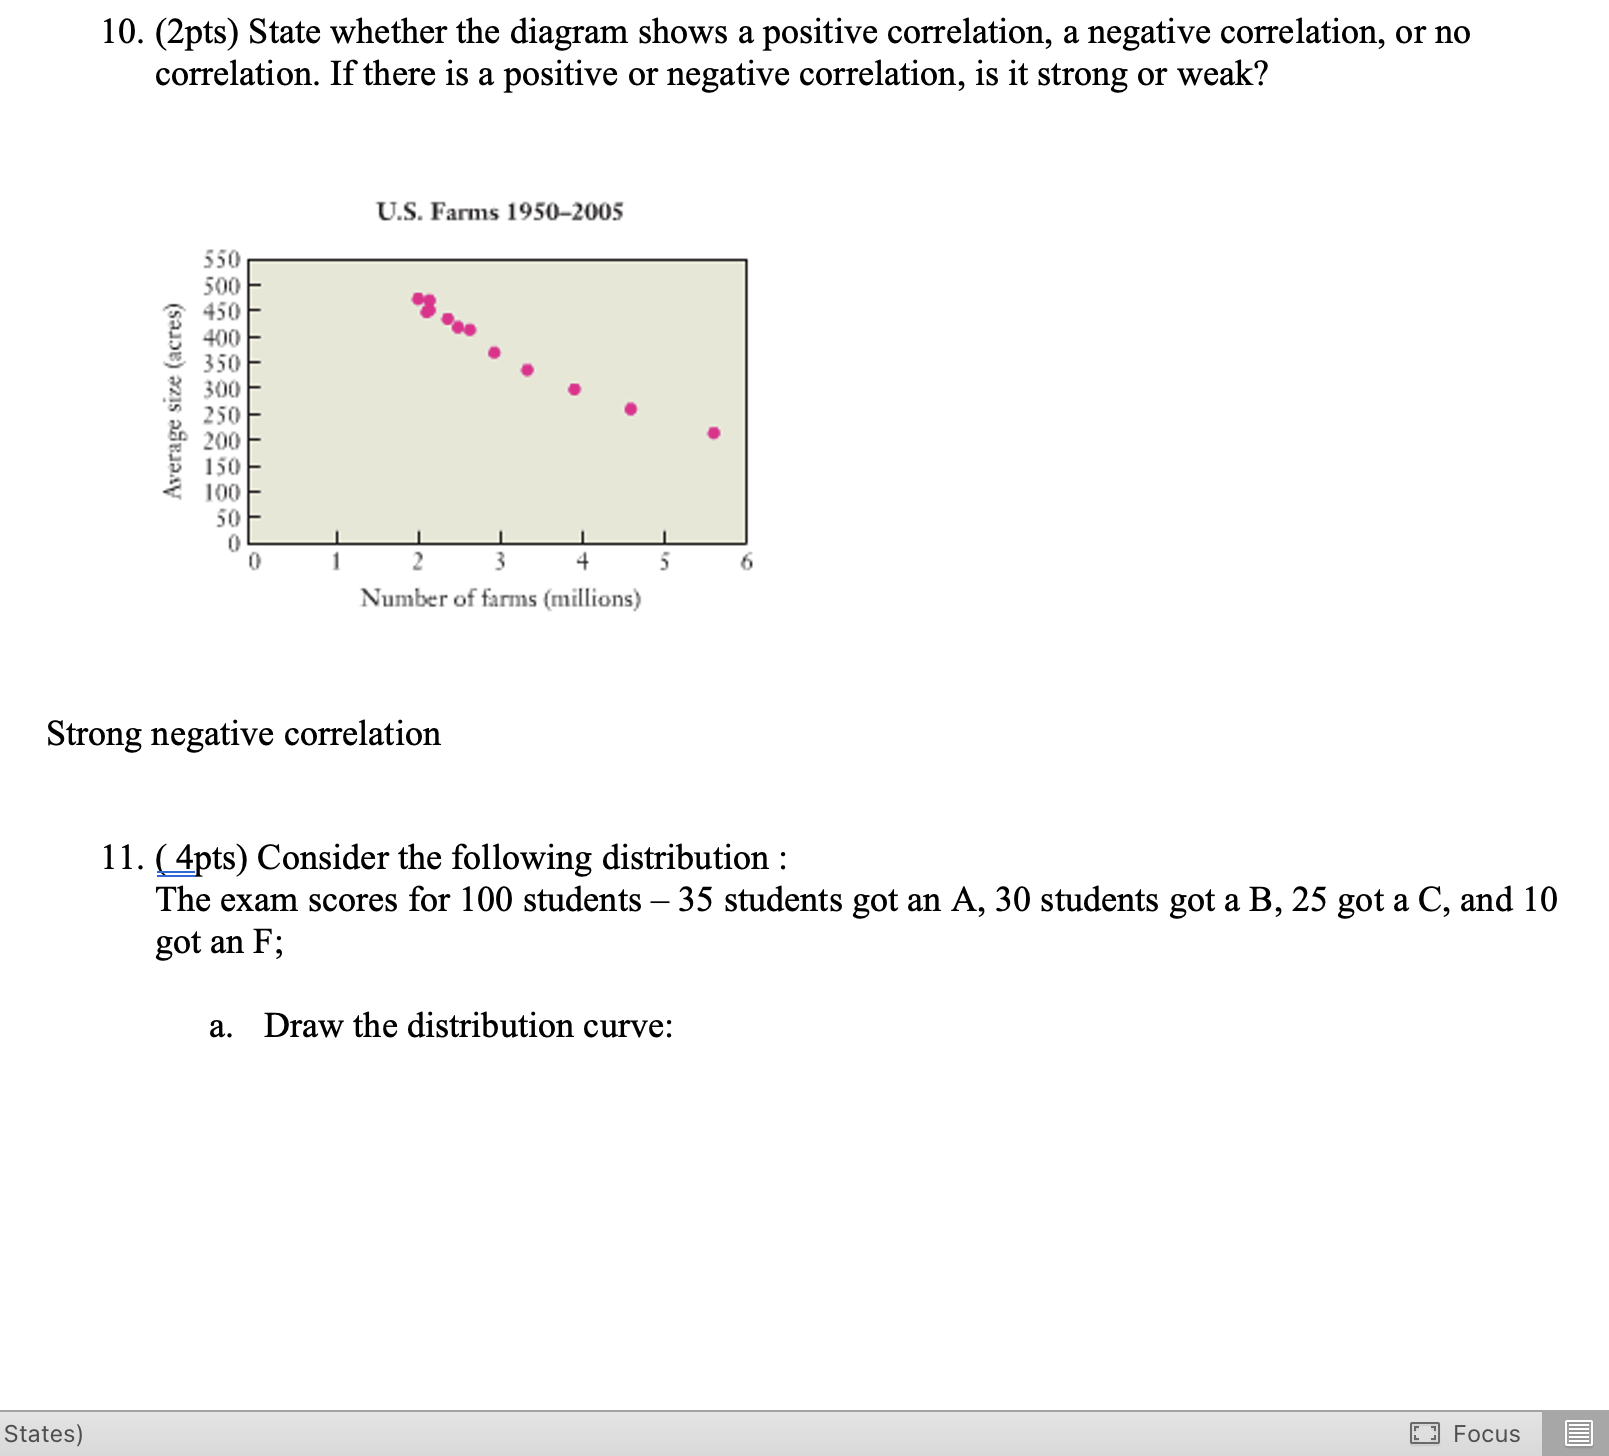
10. (2pts) State whether the diagram shows a positive correlation, a negative correlation, or no correlation. If there is a positive or negative correlation, is it strong or weak? US. Farms 1950-2005 550 500 450 4-00 350 300 250 200 150 \"10 Average sin: (acres) 0 I 2 3 4 5 6 Number of farms (millions) Strong negative correlation 11. gpts) Consider the following distribution : The exam scores for 100 students 35 students got an A, 30 students got a B, 25 got a C, and 10 got an F; a. Draw the distribution curve: States) El Focus
Step by Step Solution
There are 3 Steps involved in it

Get step-by-step solutions from verified subject matter experts