

Question: how should i classify the units by using this chart? does that seem correct? P1 H The able to content supply chain data for a
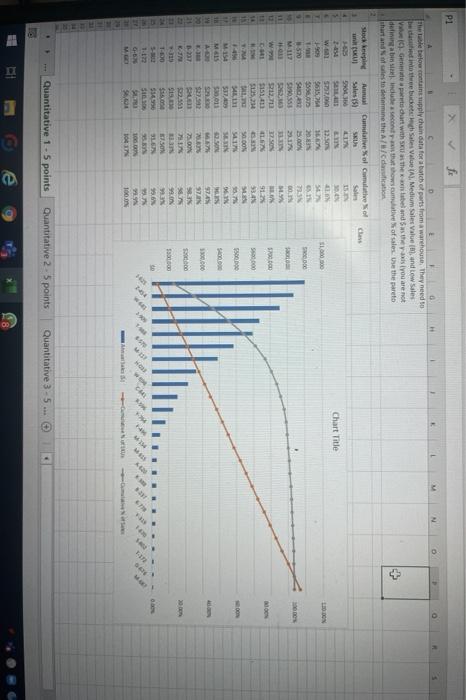
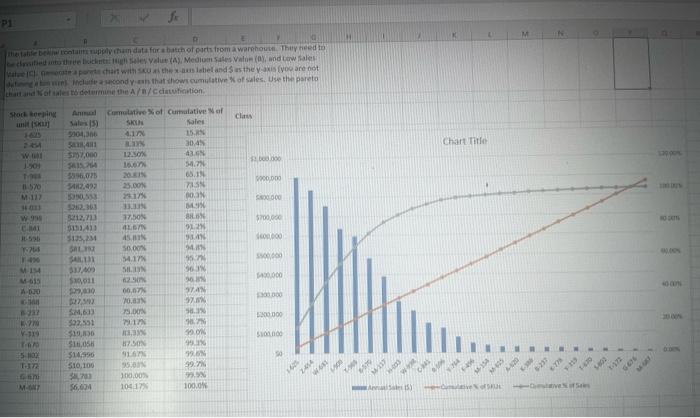
P1 H The able to content supply chain data for a bache parts from a warehouse They need to been bucket Sales Value (A), Medium Sales Value and low Sales c) Gennart with the band then you are not de bilindudes second that showsumtive of sales. Use the paret shart and to determine the dawati Stock keeping Cumulative of multivo Class Am Sales (5) 50360 . Chart Title w 90 737 3657 $936.00 12.50 16 10.DON 51.000.00 S000 50 M17 5.00 231 72 00N SO w 041 37 SON IL 500.000 91 534 $15,234 S000 11 50 DON 541 SEN 2.50 M&S $30.011 SO w 27.12 SAN SAN SON 3.300.000 21 232 23.00 000 SIS 99.00 53000 1-100 SON SEN 51450 SI 9.6 > * G- MO 100 ak Quantitative 1 - 5 points Quantitative 2.5 points Quantitative 3-5... met bewon upphan data for a bath of parts from a warehouse They need to de in the buses Value A) Medium Sales Valon (ay, and was the label and as they are not Indute condy on that shows cumulative of sales. Use the preto thantoflest determine the A//catuition Shopin imit Cla Chart Title Amal Crative of Cumulative of Sales 15) SK Sales 31043 41 15. LIN 30.4 -N SASA 54.7N 339,073 65.IN 5482.492 7 w - 000000 1570 M:112 NEO WESE NEEEE 000 DO 2363 12, 17.500 5700.000 W.99 CM MEN BL 9 914 9 95 SP co0 0.000 5. 54.17 SAN NE 40.000 AJO 3152 SAL SA 33.MD $19.011 Payana $27.2 SM,613 302.51 $19,30 Site $1356 510,100 0007 10N SON STAN 97. 5. 000 WI SVET NIGER N. NOGE 95% ON 5. W.66 55 116 550 100,00 10417 CE 23 5.000 66 MAT $6.04 1000W - P1 H The able to content supply chain data for a bache parts from a warehouse They need to been bucket Sales Value (A), Medium Sales Value and low Sales c) Gennart with the band then you are not de bilindudes second that showsumtive of sales. Use the paret shart and to determine the dawati Stock keeping Cumulative of multivo Class Am Sales (5) 50360 . Chart Title w 90 737 3657 $936.00 12.50 16 10.DON 51.000.00 S000 50 M17 5.00 231 72 00N SO w 041 37 SON IL 500.000 91 534 $15,234 S000 11 50 DON 541 SEN 2.50 M&S $30.011 SO w 27.12 SAN SAN SON 3.300.000 21 232 23.00 000 SIS 99.00 53000 1-100 SON SEN 51450 SI 9.6 > * G- MO 100 ak Quantitative 1 - 5 points Quantitative 2.5 points Quantitative 3-5... met bewon upphan data for a bath of parts from a warehouse They need to de in the buses Value A) Medium Sales Valon (ay, and was the label and as they are not Indute condy on that shows cumulative of sales. Use the preto thantoflest determine the A//catuition Shopin imit Cla Chart Title Amal Crative of Cumulative of Sales 15) SK Sales 31043 41 15. LIN 30.4 -N SASA 54.7N 339,073 65.IN 5482.492 7 w - 000000 1570 M:112 NEO WESE NEEEE 000 DO 2363 12, 17.500 5700.000 W.99 CM MEN BL 9 914 9 95 SP co0 0.000 5. 54.17 SAN NE 40.000 AJO 3152 SAL SA 33.MD $19.011 Payana $27.2 SM,613 302.51 $19,30 Site $1356 510,100 0007 10N SON STAN 97. 5. 000 WI SVET NIGER N. NOGE 95% ON 5. W.66 55 116 550 100,00 10417 CE 23 5.000 66 MAT $6.04 1000W
Step by Step Solution
There are 3 Steps involved in it

Get step-by-step solutions from verified subject matter experts