

Question: How to answer question 7a? Sketch the appropriate sampling distribution with the mean and standard error. Label the type of distribution (with degrees of freedom
How to answer question 7a? Sketch the appropriate sampling distribution with the mean and standard error. Label the type of distribution (with degrees of freedom if appropriate ), the mean and standard error, the observed value, and shade in the region for the P-Value.
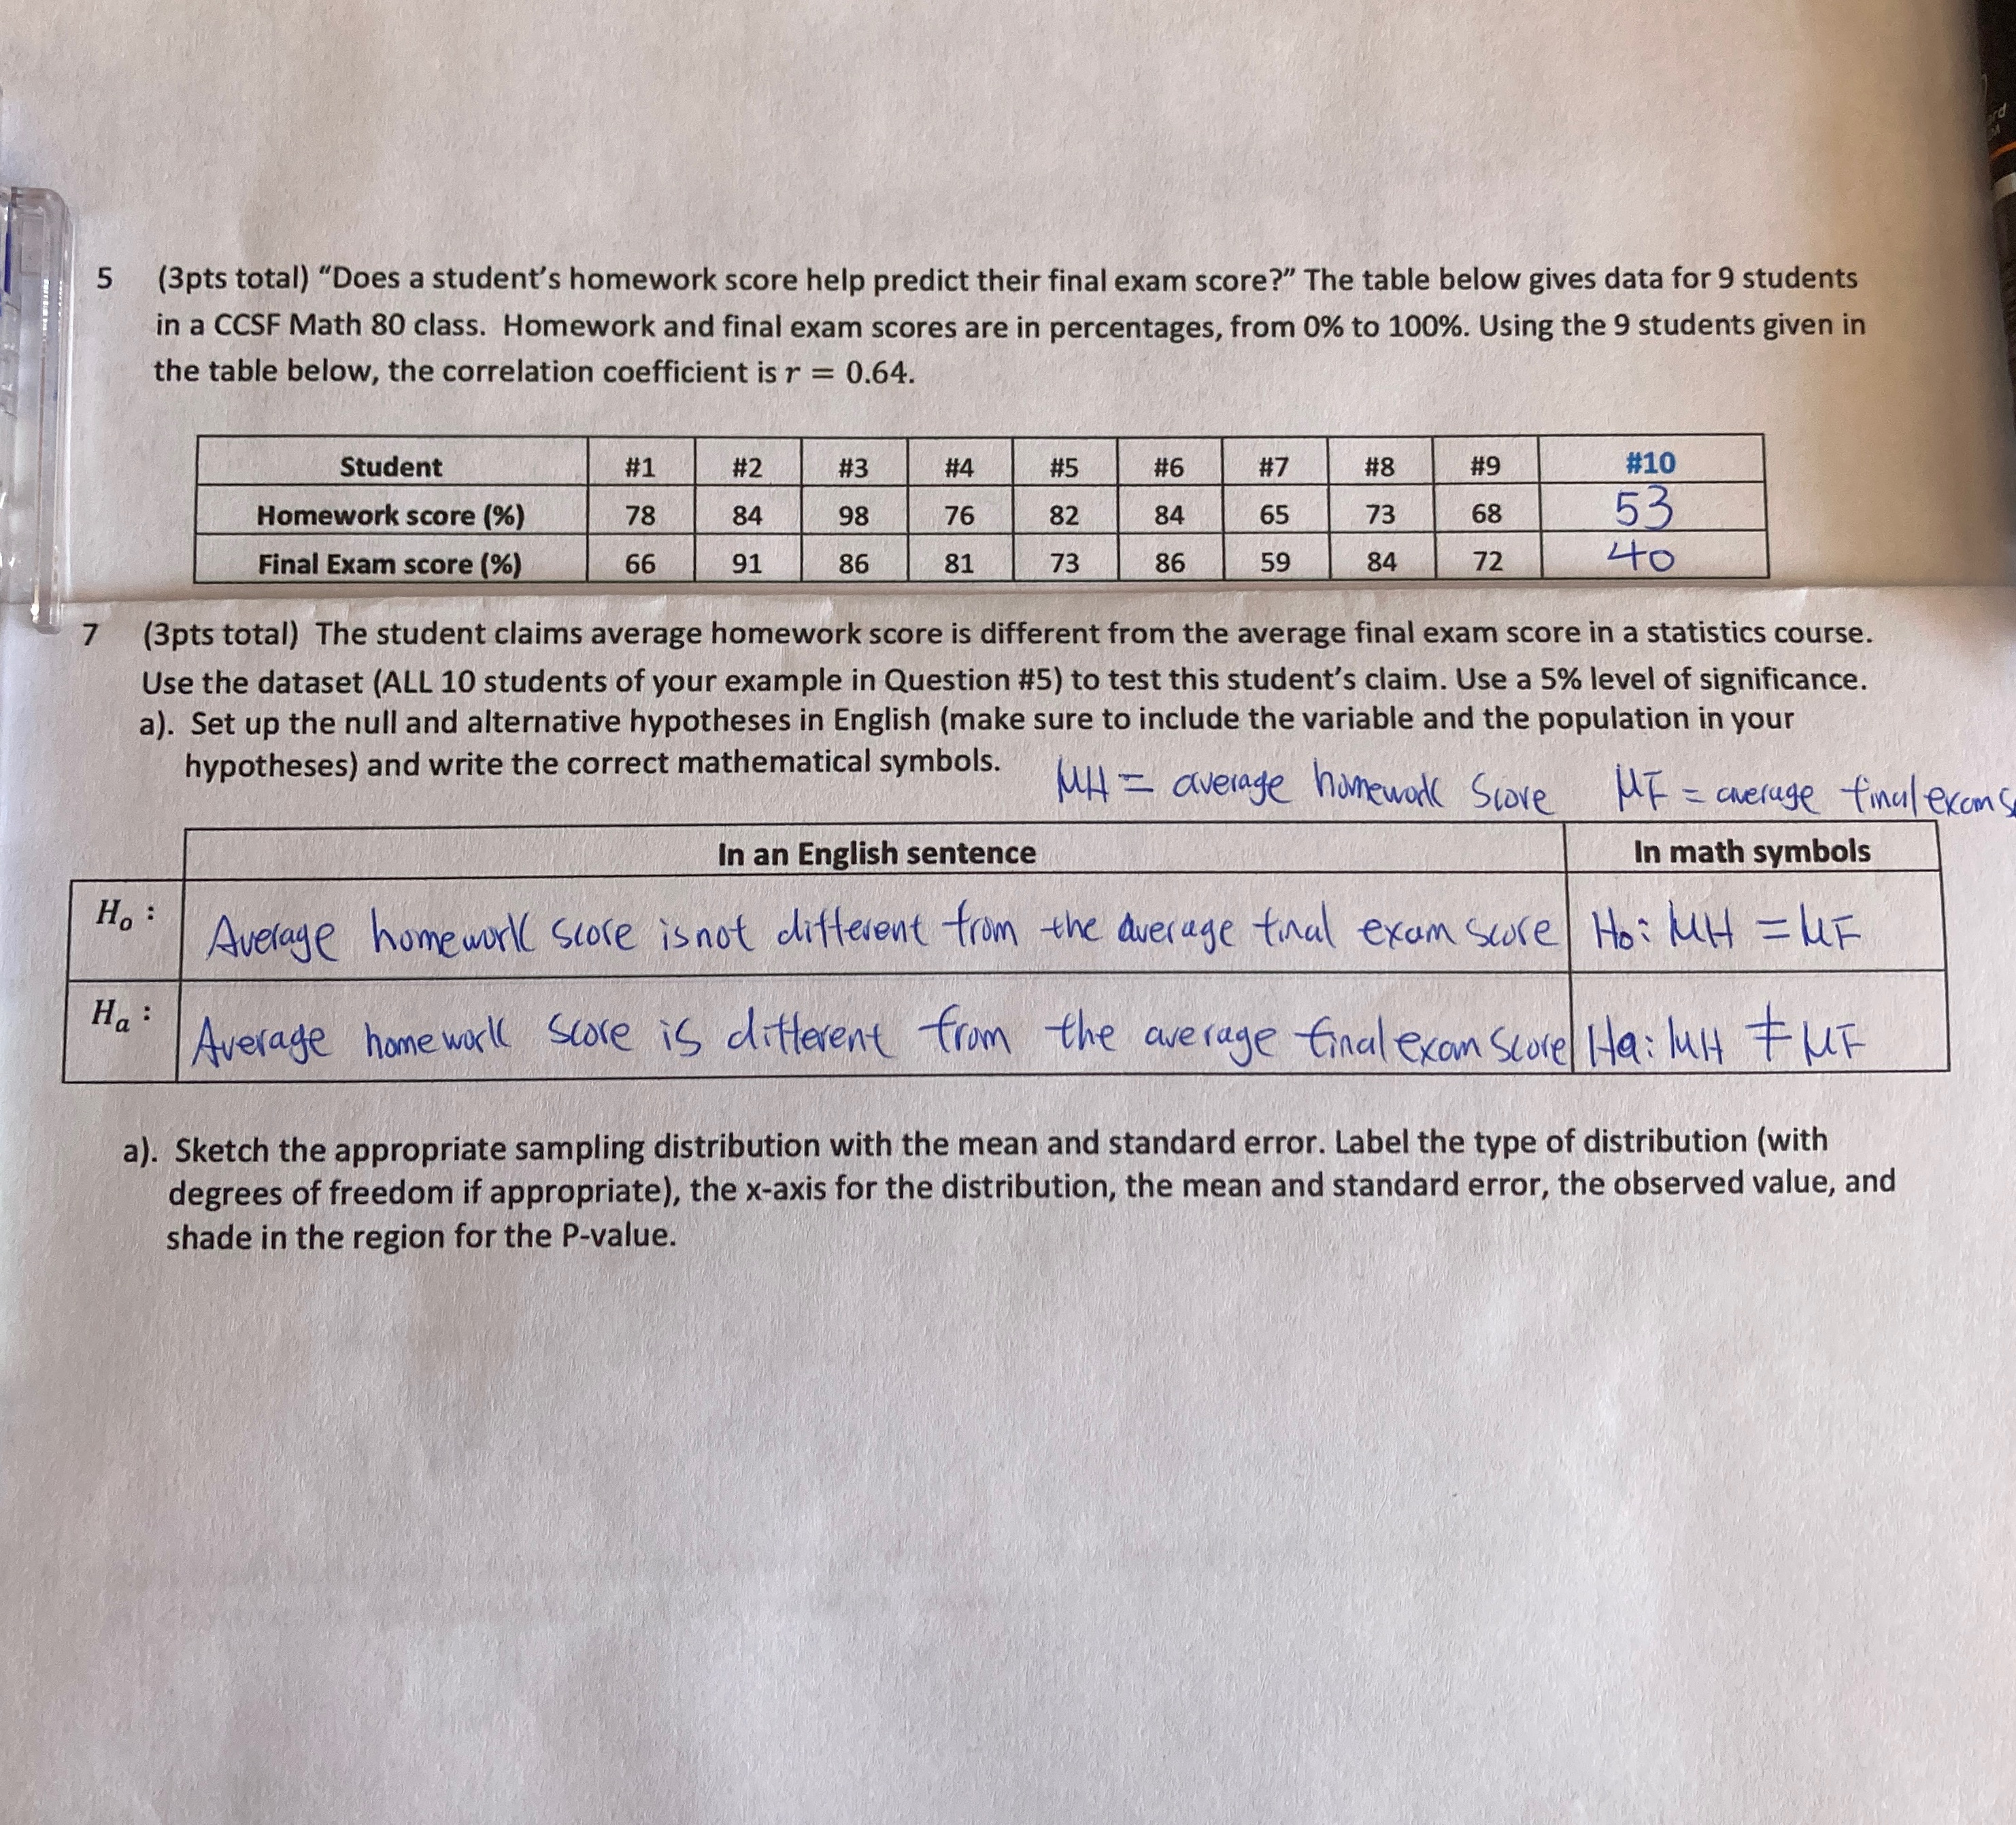
5 (3pts total) "Does a student's homework score help predict their final exam score?" The table below gives data for 9 students in a CCSF Math 80 class. Homework and final exam scores are in percentages, from 0% to 100%. Using the 9 students given in the table below, the correlation coefficient is r = 0.64. Student #1 # 2 #3 #4 #5 #6 #7 #8 #9 #10 Homework score (%) 78 84 98 76 82 84 65 73 89 53 Final Exam score (%) 66 91 86 81 73 86 59 84 72 40 (3pts total) The student claims average homework score is different from the average final exam score in a statistics course. Use the dataset (ALL 10 students of your example in Question #5) to test this student's claim. Use a 5% level of significance. a). Set up the null and alternative hypotheses in English (make sure to include the variable and the population in your hypotheses) and write the correct mathematical symbols. MH = average homework Score MF = average final exam In an English sentence In math symbols Ho Average homework score is not different from the average final exam score Hoi MH = MF Ha : Average homework score is different from the average final exam Score Ha: luH F MF a). Sketch the appropriate sampling distribution with the mean and standard error. Label the type of distribution (with degrees of freedom if appropriate), the x-axis for the distribution, the mean and standard error, the observed value, and shade in the region for the P-value
Step by Step Solution
There are 3 Steps involved in it

Get step-by-step solutions from verified subject matter experts