

Question: how to calculate Variance and SD from this data? Standard Date Adj Close Return SPY Variance Deviation begin{tabular}{|rrr|} hline 1/1/2018 & 257.83771 & -0.036360
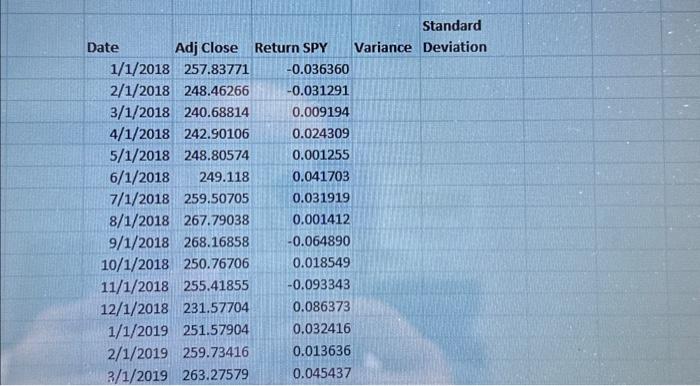
Standard Date Adj Close Return SPY Variance Deviation \begin{tabular}{|rrr|} \hline 1/1/2018 & 257.83771 & -0.036360 \\ \hline/1/2018 & 248.46266 & -0.031291 \\ \hline 3/1/2018 & 240.68814 & 0.009194 \\ \hline//1/2018 & 242.90106 & 0.024309 \\ \hline 5/1/2018 & 248.80574 & 0.001255 \\ 6/1/2018 & 249.118 & 0.041703 \\ 7/1/2018 & 259.50705 & 0.031919 \\ \hline/1/2018 & 267.79038 & 0.001412 \\ \hline/1/2018 & 268.16858 & -0.064890 \\ 10/1/2018 & 250.76706 & 0.018549 \\ 11/1/2018 & 255.41855 & -0.093343 \\ 12/1/2018 & 231.57704 & 0.086373 \\ 1/1/2019 & 251.57904 & 0.032416 \\ 2/1/2019 & 259.73416 & 0.013636 \\ 3/1/2019 & 263.27579 & 0.045437 \end{tabular}
Step by Step Solution
There are 3 Steps involved in it

Get step-by-step solutions from verified subject matter experts