

Question: How to choose the appropriate confidence interval level for testing the claim - how are we supposed to know which Confidence Interval Level to choose
How to choose the appropriate confidence interval level for testing the claim - how are we supposed to know which Confidence Interval Level to choose when using Stat Crunch?
I.E. Is it .90, .95, .98, etc. and how is one to know ?? Please see below red boxes. Thanks,
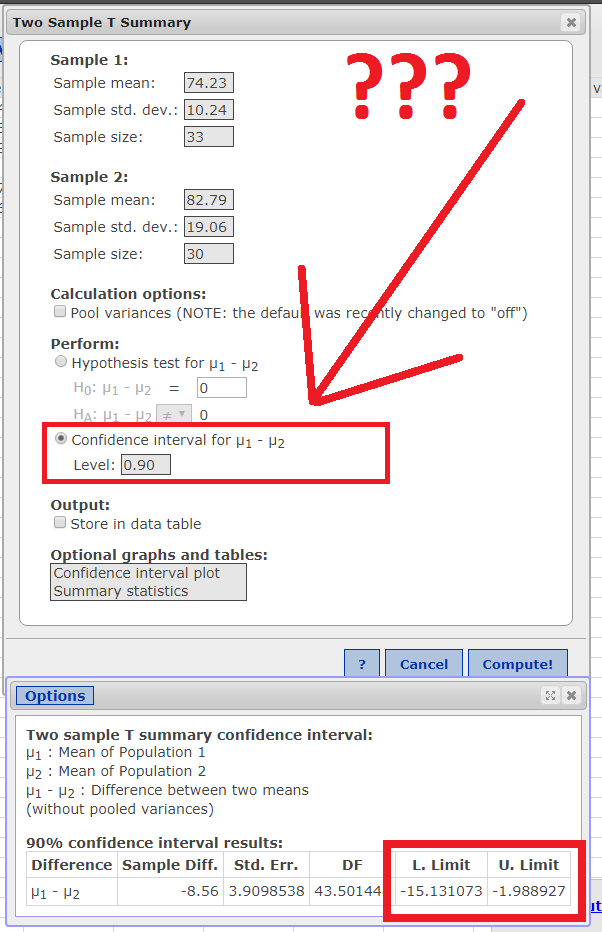
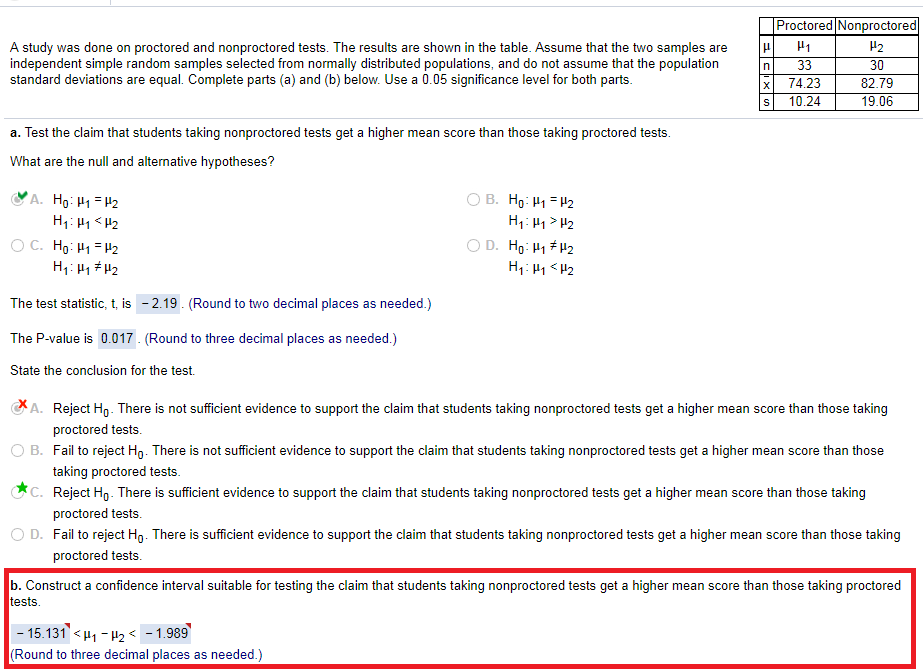
Sample 1: Sample mean: ?4.23 Sample std. dev.: 1|].24 . O . Sample size: Sample 1: Sample mean: Sample std. dev.: Sample size: Calculation options: [:1 Pool variances (NOTE: the defau was re tlv changed to \"off"} Perform: Ci vaothesis test for p1 - p2 Li} Condence interval for p1 p2 Level: [:1 Store in data table Chtional Ilrahs and tables: Condence interval plot Summarv statistics Two sample T summarijlr condence interval: p1 : Mean of Population 1 p2 : Mean of Population 2 p1 p2 : Difference between two means [without pooled variances} 90% confidence interval results: Difference Sample Diff. Std. Err. DF L. Limit U. Limit |J1 -|.J2 -B.EE 3.9D9853B 43.5D144 -15.131l]?3 4.98892? A study was done on prodored and nonproctored tests. The results are shown in the table. Assume that the two samples are independent simple random samples selected from normally distributed populations, and do not assume that the population standard deviations are equal. Complete parts (a) and to} below. Use a [1.05 significance level for both parts. a. Test the claim that students taking nonproctored tests get a higher mean score than those taking proctored tests. What are the null and altemative hypotheses? til-'A. Huzu1= I12 Ci:- ES. H\": p1 = p2 HI:|.I1
Step by Step Solution
There are 3 Steps involved in it

Get step-by-step solutions from verified subject matter experts