

Question: how to determine binominal or geometric by looking at graph? 16.9 The figure shows the probability distribution of a discrete random variable X. Note that
how to determine binominal or geometric by looking at graph? 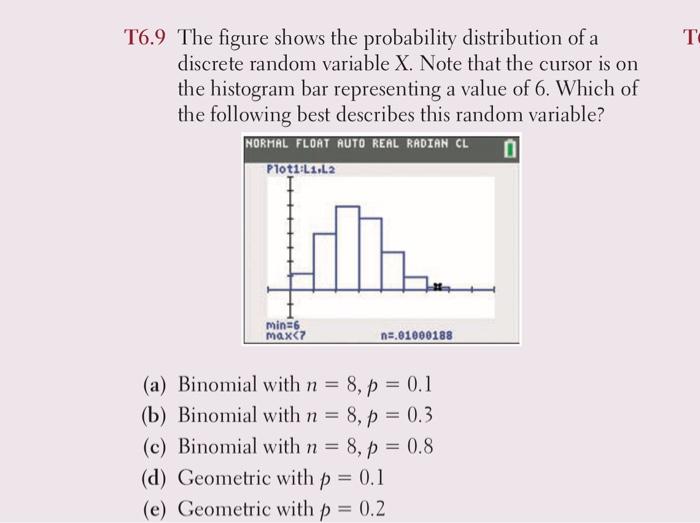
16.9 The figure shows the probability distribution of a discrete random variable X. Note that the cursor is on the histogram bar representing a value of 6 . Which of the following best describes this random variable? (a) Binomial with n=8,p=0.1 (b) Binomial with n=8,p=0.3 (c) Binomial with n=8,p=0.8 (d) Geometric with p=0.1 (e) Geometric with p=0.2
Step by Step Solution
There are 3 Steps involved in it
1 Expert Approved Answer
Step: 1 Unlock

Question Has Been Solved by an Expert!
Get step-by-step solutions from verified subject matter experts
Step: 2 Unlock
Step: 3 Unlock