

Question: How to develop a GLO-Bus 3 year strategic plan answering the questions about B company Craft a Strategic Vision Statement Set objectives and performance targets
How to develop a GLO-Bus 3 year strategic plan answering the questions about B company
- Craft a Strategic Vision Statement
- Set objectives and performance targets
- Declare and define the company's camera strategy
- Declare and define the company's drone strategy
- Generate Revenue-Cost-Profit projections for the upcoming 3 years
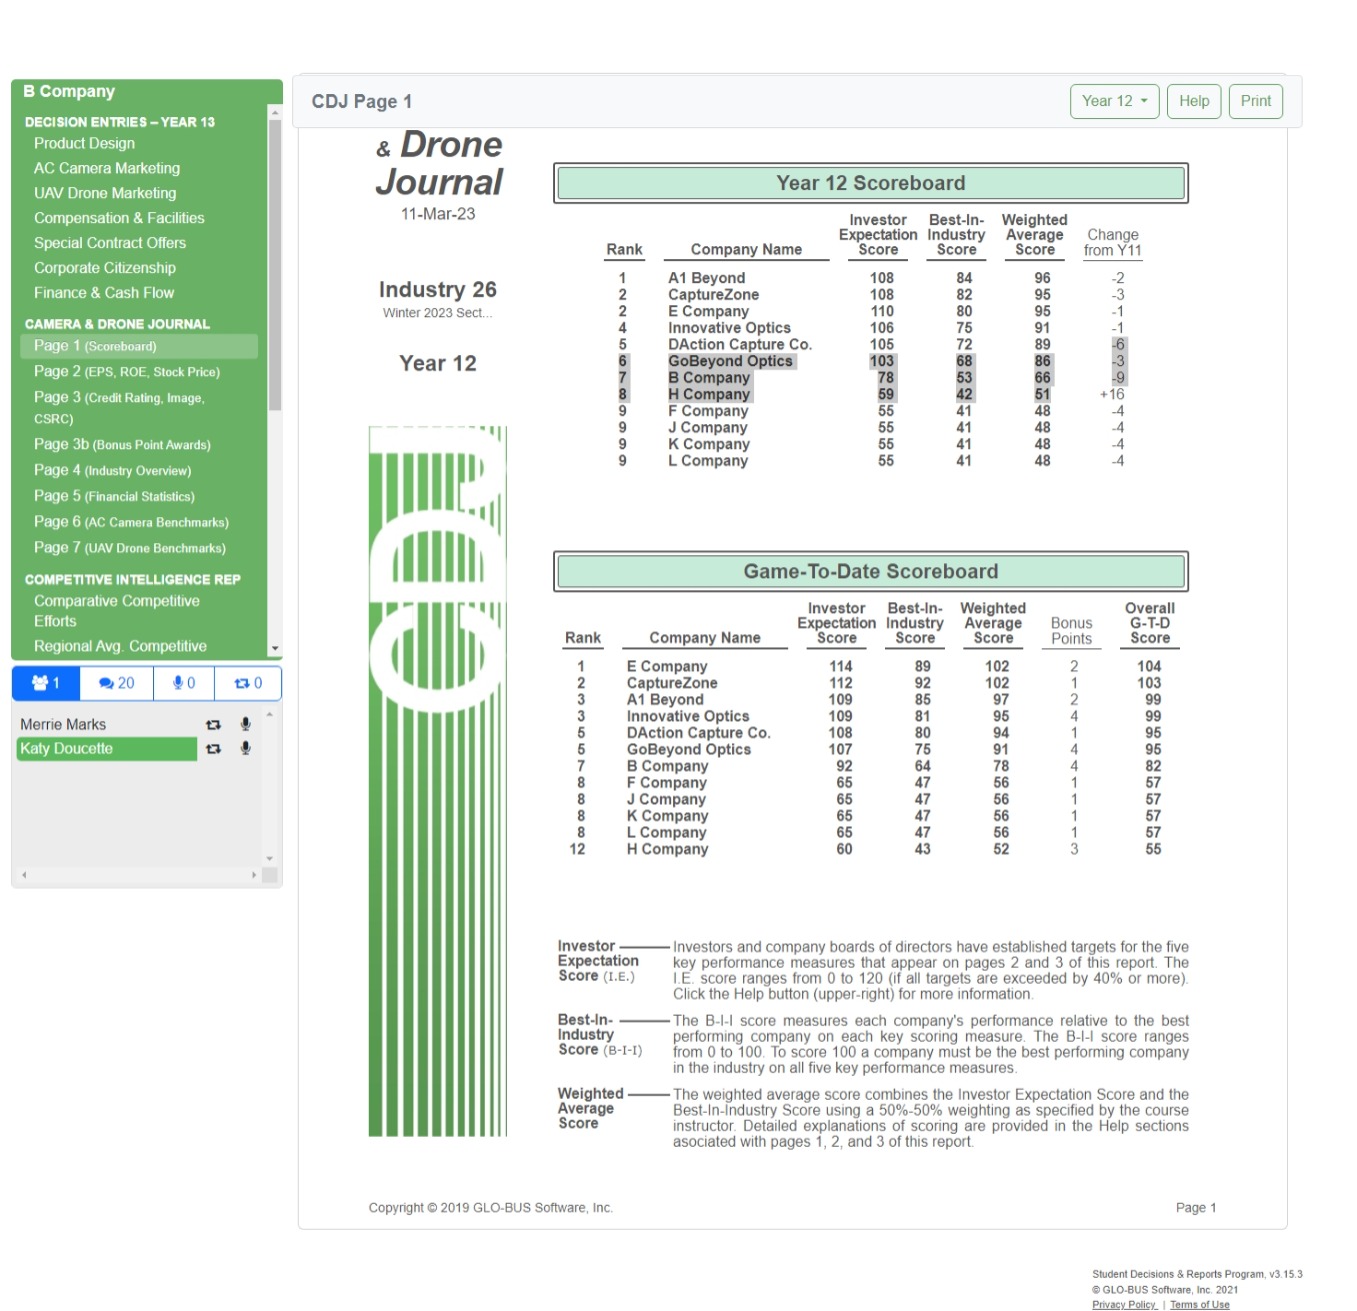
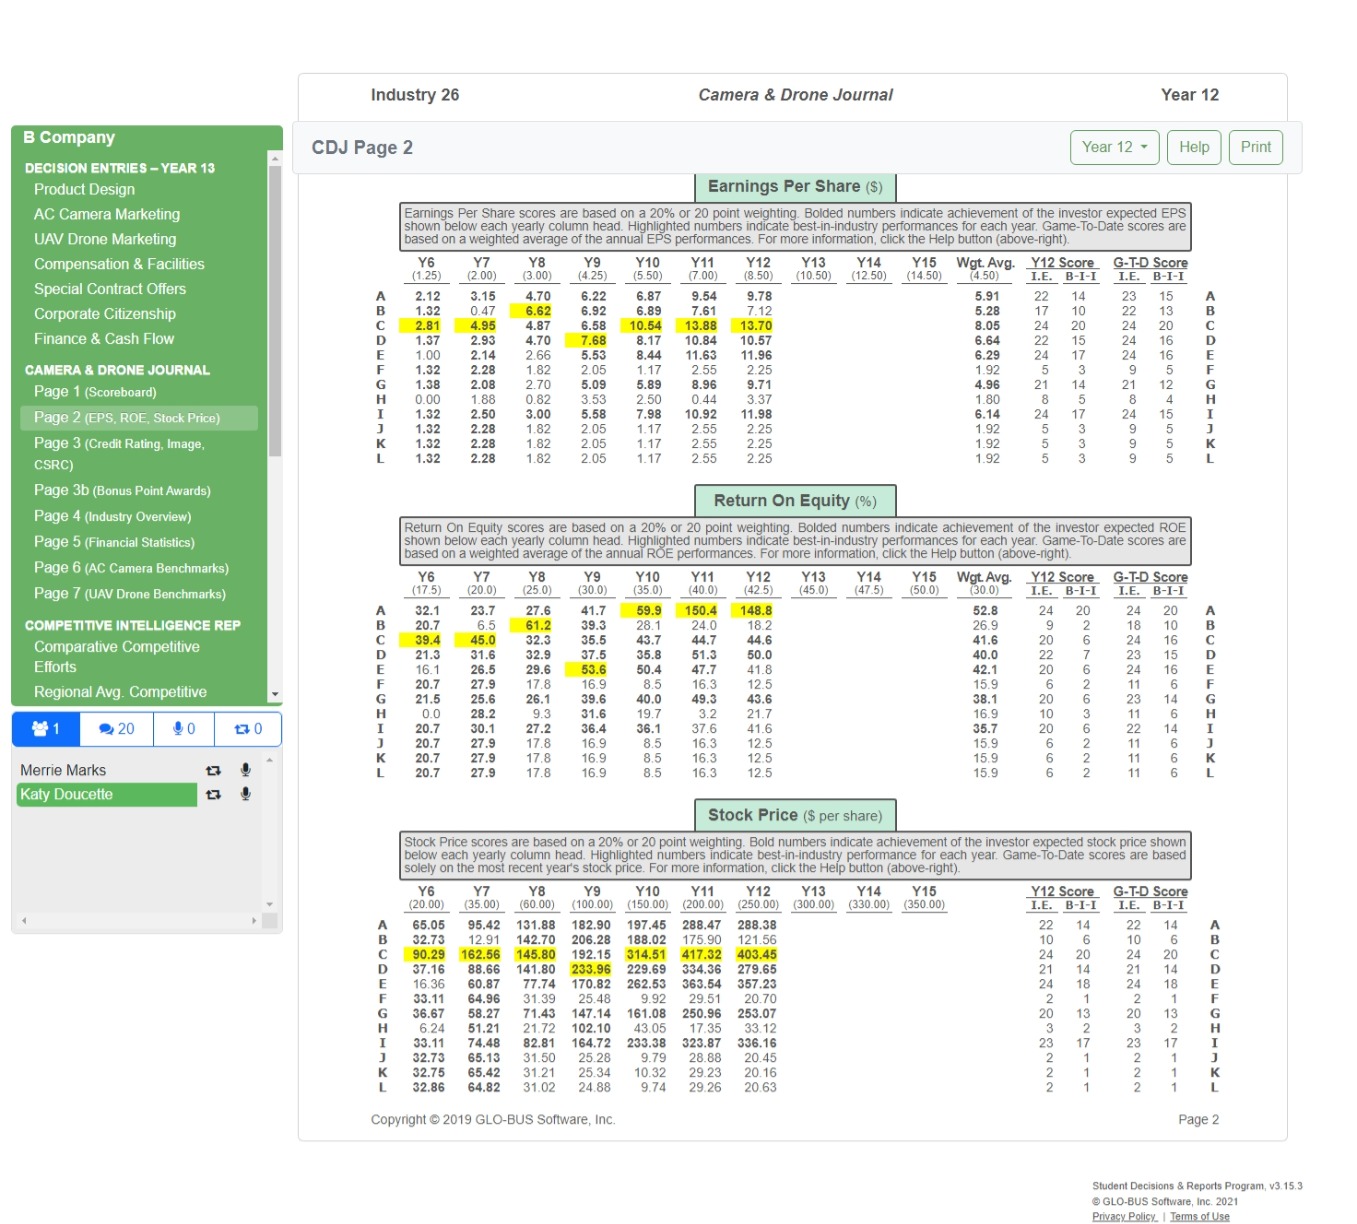
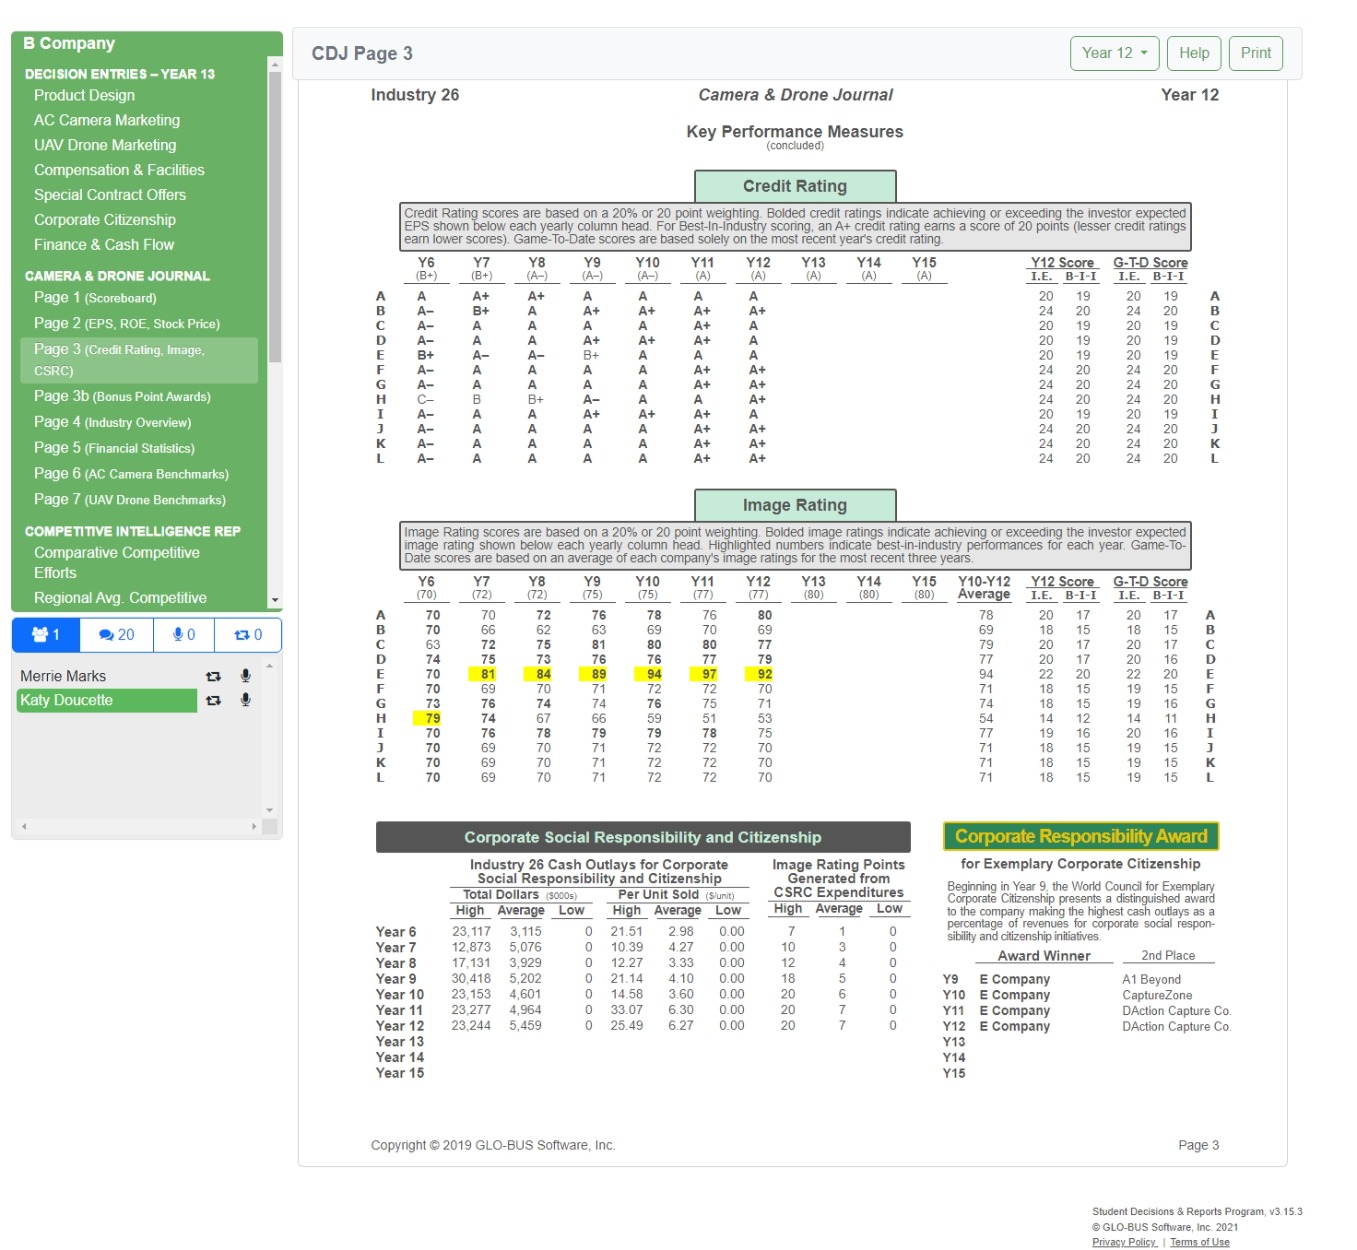
B Company CDJ Page 1 Year 12 - Help Print DECISION ENTRIES - YEAR 13 Product Design & Drone AC Camera Marketing UAV Drone Marketing Journal Year 12 Scoreboard Compensation & Facilities 11-Mar-23 Investor Best-In- Weighted Expectation Industry Average Change Special Contract Offers Rank Company Name Score Score Score from Y11 Corporate Citizenship A1 Beyond 108 96 Finance & Cash Flow Industry 26 CaptureZone 108 95 Winter 2023 Sect.. E Company 110 95 CAMERA & DRONE JOURNAL Innovative Optics 106 Page 1( DAction Capture Co. 105 72 GoBeyond Optics 103 Page 2 (EPS, ROE, Stock Price) Year 12 B Company 78 53 Page 3 (Credit Rating, Image, H Company 59 F Company 41 CSRC) J Company Page 3b (Bonus Point Awards) K Company L Company 56 41 Page 4 (Industry Overview) Page 5 (Financial Statistics) Page 6 (AC Camera Benchmarks) Page 7 (UAV Drone Benchmarks) Game-To-Date Scoreboard COMPETITIVE INTELLIGENCE REP Comparative Competitive Investor Best-In- Weighted veral Efforts Expectation Industry Average onus G-T-D Rank Company Name Score Score Score Points Score Regional Avg. Competitive E Company 114 102 - N 104 20 170 CaptureZone 112 103 A1 Beyond 109 97 Innovative Optics 109 96 Merrie Marks 3 DAction Capture Co. 108 94 95 Katy Doucette GoBeyond Optics 107 B Company 92 78 82 F Company 47 J Company 65 47 57 K Company 65 47 56 57 L Company 65 57 H Company 60 43 52 56 Investor Investors and company boards of directors have established targets for the five Expectation key performance measures that appear on pages 2 and 3 of this report. The Score (I.E.) .E. score ranges from 0 to 120 (if all targets are exceeded by 40% or more). Click the Help button (upper-right) for more information. Best-In The B-I-I score measures each company's performance relative to the best Industry performing company on each key scoring measure. The B-I-I score ranges Score (B-I-I) from 0 to 100. To score 100 a company must be the best performing company in the industry on all five key performance measures. Weighted The weighted average score combines the Investor Expectation Score and the Average Best-In-Industry Score using a 50%-50% weighting as specified by the course Score instructor. Detailed explanations of scoring are provided in the Help sections asociated with pages 1, 2, and 3 of this report. Copyright @ 2019 GLO-BUS Software, Inc. Page 1 Student Decisions & Reports Program, v3.15.3 GLO-BUS Software, Inc. 2021Industry 26 Camera & Drone Journal Year 12 B Company CDJ Page 2 Year 12 - Help Print DECISION ENTRIES - YEAR 13 Product Design Earnings Per Share ($) AC Camera Marketing gs Per Share scores are based on a 20% or 20 point weighting. Bolded numbers indicate achievemen te achievement of the investor expected EPS shown below each yearly column head. Highlighted numbers indicate best-in-industry performances for each year. Game-To-Date scores are UAV Drone Marketing based on a weighted average of the annual EPS performances. For more information, click the Help button (abov Compensation & Facilities Y6 Y7 Y8 Y9 Y10 Y11 Y12 Y13 Y14 Y15 Wgt. Avg. Y12 Score G-T-D Score (1.25) 2.00) 3.001 (4.25) (5.50) (7.00) (8.50) 10.50) (12.50) (14.50) (4.50) I.E. B-I-I I.E. B-I-I Special Contract Offers 2.12 3.15 6.22 6.87 9.54 9.78 5.91 22 14 23 15 Corporate Citizenship 1.32 0.47 6.62 6.92 6.89 7.61 7.12 5.28 13 2.81 4.95 4.87 6.58 10.54 13.88 13.70 8.05 20 TMOOD Finance & Cash Flow 1.37 2.93 4.70 7.68 8.17 10.84 10.57 6.64 22 1.00 2.14 2.66 5.53 11.63 6.29 24 HIATMOOWD CAMERA & DRONE JOURNAL 1.32 2.28 1.82 2.05 2.55 2.25 1.92 5 1.38 2.08 2.70 5.09 5.89 8.96 9.71 4.96 21 Page 1 (Scoreboard) H 0.00 1.88 0.82 3.53 2.50 0.44 3.37 1.80 Page 2 (EPS, ROE, Stock Price) I 1.32 2.50 3.00 5.58 10.92 11.98 6.14 24 1.32 2.28 1.82 2.05 1.17 2.55 2.25 1.92 Page 3 (Credit Rating, Image, K 1.32 2.28 1.82 2.05 2.55 2.25 1.92 1.32 2 .28 1.82 2.05 1.17 2.55 2 25 1.92 CSRC) Page 3b (Bonus Point Awards) Return On Equity (%) Page 4 (Industry Overview) Return On Equity scores are based on a 20% or 20 point weighting. Bolded numbers indicate achievement of the investor expected ROE Page 5 (Financial Statistics) shown below each yearly column head. Highlighted numbers indicate best-in-industry performances for each year. Game-To-Date scores are based on a weighted average of the annual ROE performances. For more information, click the Help button (above-right). Page 6 (AC Camera Benchmarks) Y6 Y7 Y8 Y9 Y10 Y11 Y12 Y13 Y14 Y15 Wgt. Avg 12 Score G-T-D Score Page 7 (UAV Drone Benchmarks) (17.5) (20.0) (25.0) (30.0) (35.0) 40.0 42.5 (45.0) (47.5) 50.0 (30.0) B- I- B-I-I 32.1 23.7 27.6 41.7 59.9 150.4 148.8 52.8 COMPETITIVE INTELLIGENCE REP 20.7 61.2 39.3 28.1 24.0 18.2 26.9 39.4 32.3 41.6 Comparative Competitive 32.9 35.5 43.7 44.7 44.6 21. 37.5 35.8 51.3 50.0 40.0 Efforts 16.1 19.6 53.6 50.4 47.7 41.8 42.1 20 20.7 7.8 16.9 85 16.3 12 5 15.9 NNNOWONVONS Regional Avg. Competitive 21.5 26.1 39.6 40.0 49.3 43.6 38.1 20 0.0 9.3 31.6 19.7 3.2 21.7 16.9 10 20 170 20.7 30.1 27.2 36.4 36.1 37.6 41.6 35.7 20 14 20.7 27.9 17.8 8.5 16.3 12.5 15.9 20.7 27.9 17.8 16.9 8.5 16.3 12.5 15.9 FX Merrie Marks 20.7 27.9 17.8 16.9 8.5 16.3 12.5 15.9 Katy Doucette Stock Price ($ per share) Stock Price scores are based on a 20% or 20 point weighting. Bold numbers indicate achievement of the investor expected stock price shown below each yearly column head. Highlighted numbers indicate best-in-industry performance for each year. Game-To-Date scores are based solely on the most recent year's stock price. For more information, click the Help button (above-right). Y6 Y9 Y10 Y12 Y13 Y14 Y15 Score (20.00) (35.00) (60.00) (100.00) (150.00) (200.00) (250.00) (300.00) (330.00) (350.00) . B-I-I $5.05 95.42 131.88 182.90 197.45 288.47 288.38 12.73 12 91 142.70 206.28 188.02 175.90 121.56 mona> 90.29 162.56 145.80 192.15 314.51 417.32 403.45 37.16 88.66 141.80 233.96 229.69 334.36 279.65 16.36 60.87 77.74 170.82 262.53 363.54 357.23 33.11 64.96 $1.39 25.48 9.92 29.51 20.70 FXUHIOTMOOG> 36.67 58.27 71.43 147.14 161.08 250.96 253.07 6.24 51.21 21.72 102.10 43.05 17.35 33.12 33.11 74.48 82.81 164.72 233.38 323.87 336.16 -XUHIO 32.73 65.13 31.50 25.28 9.79 28.88 20.45 32.75 65.42 31.21 25.34 10.32 29.23 20.16 32.86 64.82 31.02 24.88 9.74 29.26 20.63 Copyright @ 2019 GLO-BUS Software, Inc Page 2 Student Decisions & Reports Program, v3.15.3 GLO-BUS Software, Inc. 2021B Company CDJ Page 3 Year 12 - Help Print DECISION ENTRIES - YEAR 13 Product Design Industry 26 Camera & Drone Journal Year 12 AC Camera Marketing Key Performance Measures UAV Drone Marketing (concluded) Compensation & Facilities Credit Rating Special Contract Offers Corporate Citizenship Credit Rating scores are based on a 20% or 20 point weighting. Bolded credit ratings indicate achieving or exceeding the investor expected EPS shown below each yearly column head. For Best-In-Industry scoring, an A+ credit rating earns a score of 20 points (lesser credit ratings Finance & Cash Flow earn lower scores). Game-To-Date scores are based solely on the most recent year's credit rating. Y12 Y13 Y14 G-T-D Score CAMERA & DRONE JOURNAL (B+) YA1 ( A) Y15 Y12 Score .E. B-I-I I.E. B-I-I Page 1 (Scoreboard) 20 19 Page 2 (EPS, ROE, Stock Price) Page 3 (Credit Rating, Image, DDDDUDDPOPPA CSRC) DDDDDDDDDDPA PARDARRDDDAD 24 FXUHIOTMONAD PPPPPPPPPPPP FXUHIOTMONOD 24 Page 3b (Bonus Point Awards) 20 20 Page 4 (Industry Overview) 24 20 24 20 24 Page 5 (Financial Statistics) 24 Page 6 (AC Camera Benchmarks) Page 7 (UAV Drone Ber mage Rating COMPETITIVE INTELLIGENCE REP Rating g & ed ima gs indicate achieving or exceeding the investor expected age ra ers inc ate best-in-industry performances for each ye Comparative Competitive 9.2 2 1959 te scores G I rating the most recent th it three years. Efforts Y1 10-Y12 Regional Avg. Competitive 80) 12 Score T-D Score 8 1 2 20 170 Merrie Marks -HIOTMOOD Katy Doucette 17 FXUHIOTMOOD 71 18 18 15 19 Corporate Social Responsibility and Citizenship Corporate Responsibility Award ndustry 26 Cash Outlays for Corporate mage Rating Points for Exemplary Corporate Citizenship Social Responsibility and Citizenship Generated from Beginning in Year 9, the World Council for Exemplary Total Dollars ($000s) Per Unit Sold (S/unit) CSRC Expenditures Corporate Citizenship presents a distinguished award High Average Low High Average Low High Average Low to the company making the highest cash outlays as a Year 6 23, 117 3,115 0 21.51 2.98 0.00 7 0 percentage of revenues for corporate social respon sibility and citizenship initiatives. Year 7 12,873 5,076 0 10.39 4.27 0.00 10 0 Year 8 3,929 12.27 3.33 0.00 0 Award Winner 2nd Place Year 9 30,418 0 21.14 4.10 0.00 18 0 Y9 E Company A1 Beyond Year 10 23, 153 4,601 0 14.58 3.60 0.00 20 Y10 E Company CaptureZone Year 11 23,277 4,964 0 33.07 6.30 0.00 20 0 Y11 E Company DAction Capture Co Year 12 23,244 5.459 0 25.49 6.27 0.00 20 7 0 Y12 E Company DAction Capture Co. Year 13 Y13 Year 14 Y14 Year 15 v15 Copyright @ 2019 GLO-BUS Software, Inc. Page 3 Student Decisions & Reports Program, v3.15.3 GLO-BUS Software, Inc. 2021
Step by Step Solution
There are 3 Steps involved in it

Get step-by-step solutions from verified subject matter experts