

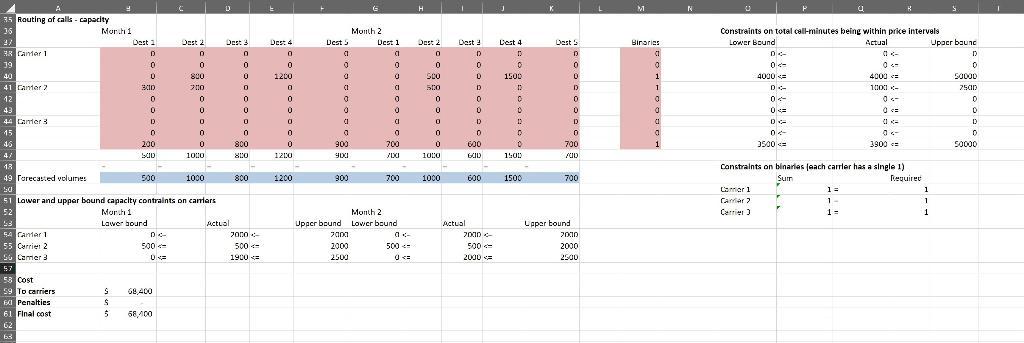
Question: How to do a sensitivity analysis in Excel with the following data. Decision variables are in red, inputs are in blue. The optimal solution (final
How to do a sensitivity analysis in Excel with the following data. Decision variables are in red, inputs are in blue. The optimal solution (final cost)has already been found, just not sure what data to use in a table to perform the sensitivity analysis.
![г GM NP RD D1 Carrler selection for telecommunication company with volume discounts 20D قومی ] 3 Inputs 4 Price intervals](https://dsd5zvtm8ll6.cloudfront.net/si.experts.images/questions/2022/11/6385813b36845_1669693754185.jpg)
D 1 Carrler selection for telecommunication company with volume discounts 3 Inputs 5 6 Carrier 1 Price intervals 8 9 Carrier 2 10 11 12 Carrier 3 13 14 15 16 Unit prices 17 18 Carrier 1 19 21 Carrier 2 22 23 21 Carrier 3 25 26 27 28 Penalties per call-minute 29 30 31 Carrier 1 32 Carrier 2 33 Carrier 3 34 Lower limit D Manth 1 Month 1 2000 4000 0 2500 5000 D 2000 3500 Dest 1 9 8 7 10 9 8 8 7 6 Dest 1 2 Upper limit 2000 4000 sanoa 2500 5000 50000 2000 3500 S0000 Dest 2 12 10 8 13 11 9 14 12 10 Dest 2 Dest 3 15 13 10 17 15 13 17 13 9 Dest 3 7 De 4 10 8 3 11 9 5 12 10 8 Dest 4 r Dest 5 15 13. 10 16 14 12 14 12 y Dest 5 G Month 2 Des 1 9 8 7 Month 2 10 9 8 3 7 G Dest 1 2 Dest 2 12 10 8 13 11 9 11 12 10 Dest 2 Dest 3 15 13 10 17 15 13 17 13 4 Dest 3 Dest 4 10 8 5 11 9 5 12 10 8 Dest 4 Dest 5 15 13 10 16 14 12 14 12 9 Dest 5 M N Lower and upper bounds on capacity Month 1 Carrier 1 Carrier 2 Carrier 3 Lower bound 0 500 0 P Month 2 Upper bound Lower bound Upper bound 2000 2000 2000 2500 0 4:00 0 2000 2.500 R
Step by Step Solution
3.33 Rating (159 Votes )
There are 3 Steps involved in it
Question The question has been correctly solved in the excel However it would not be possibl... View full answer

Get step-by-step solutions from verified subject matter experts