Question: how to do the DCF for this ? start from 2017-2021 thankyou Costco Wholesale Corp (COST US) - BBG Adjusted In Millions of USD except
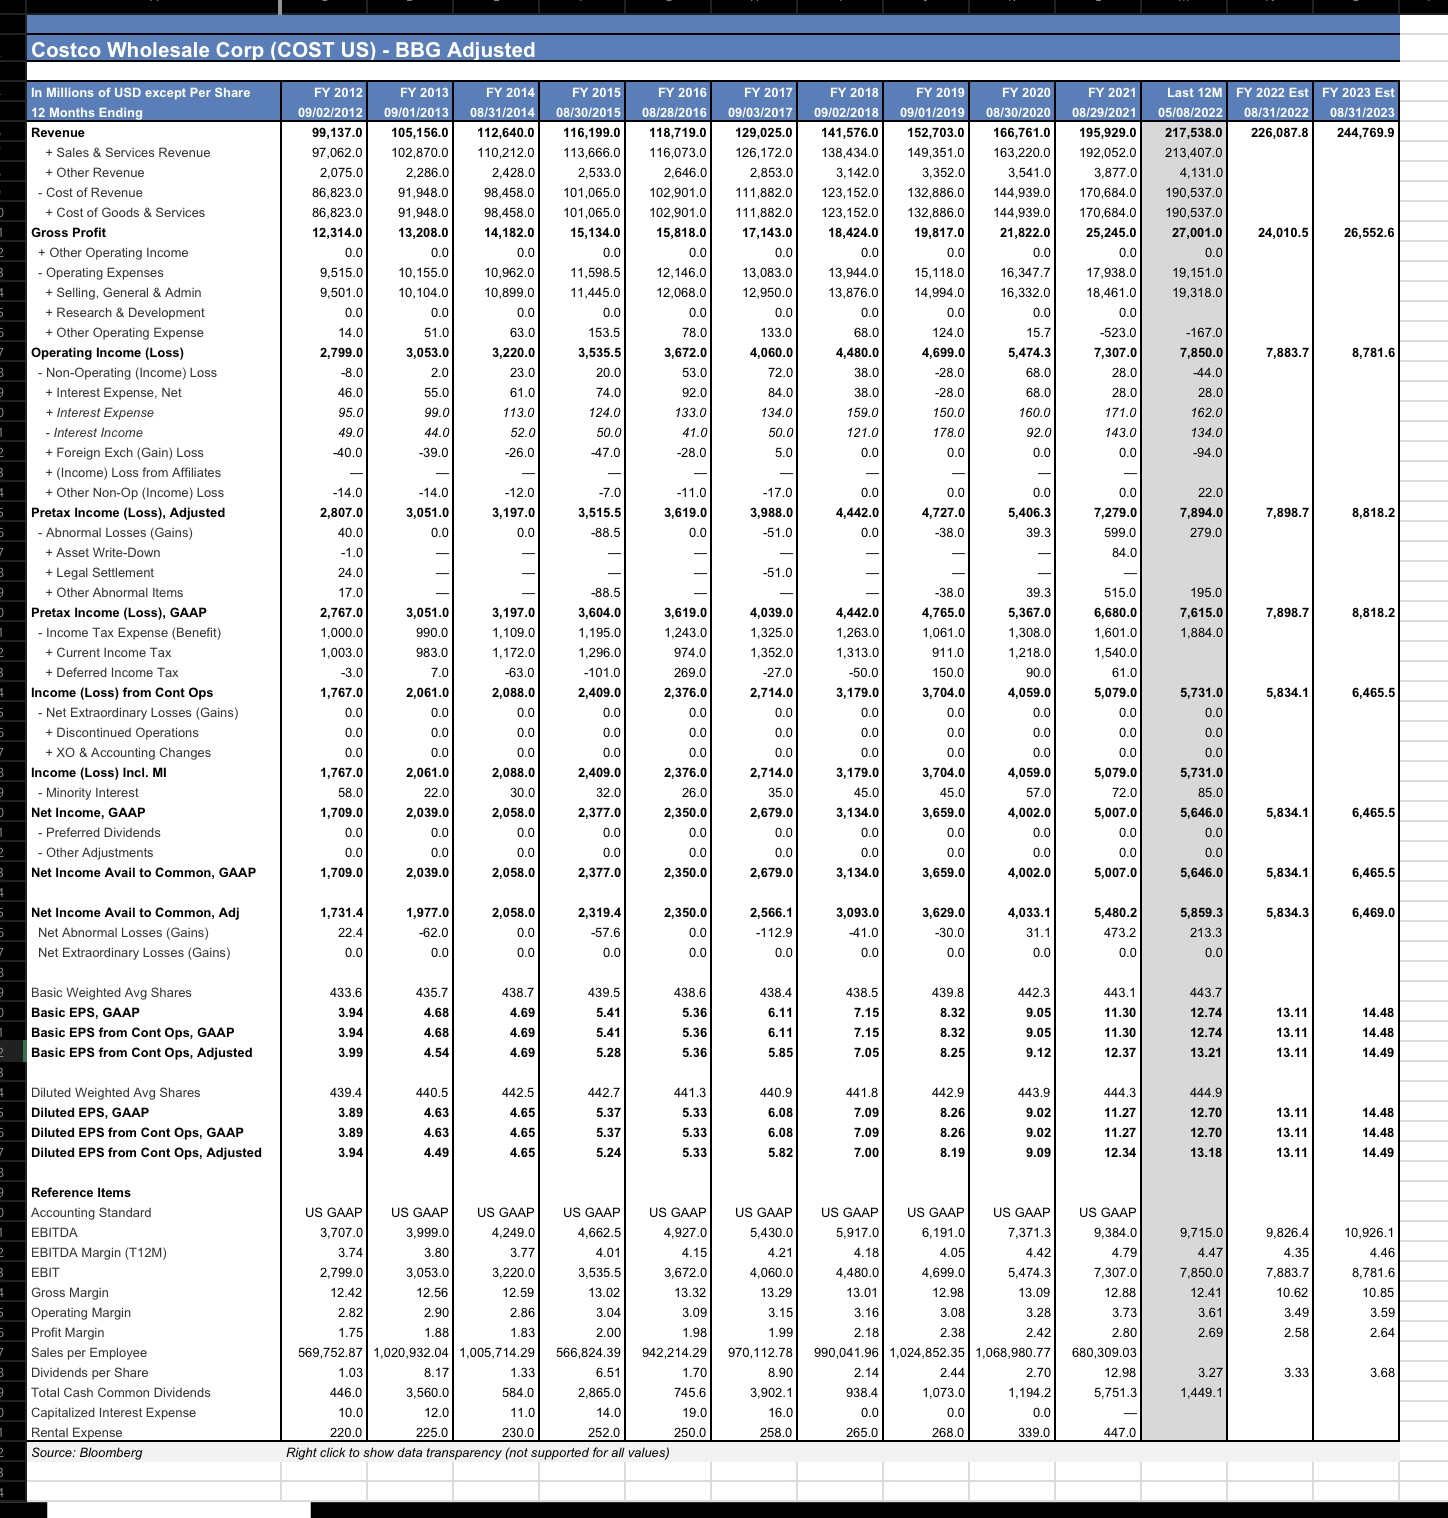
how to do the DCF for this ? start from 2017-2021 thankyou
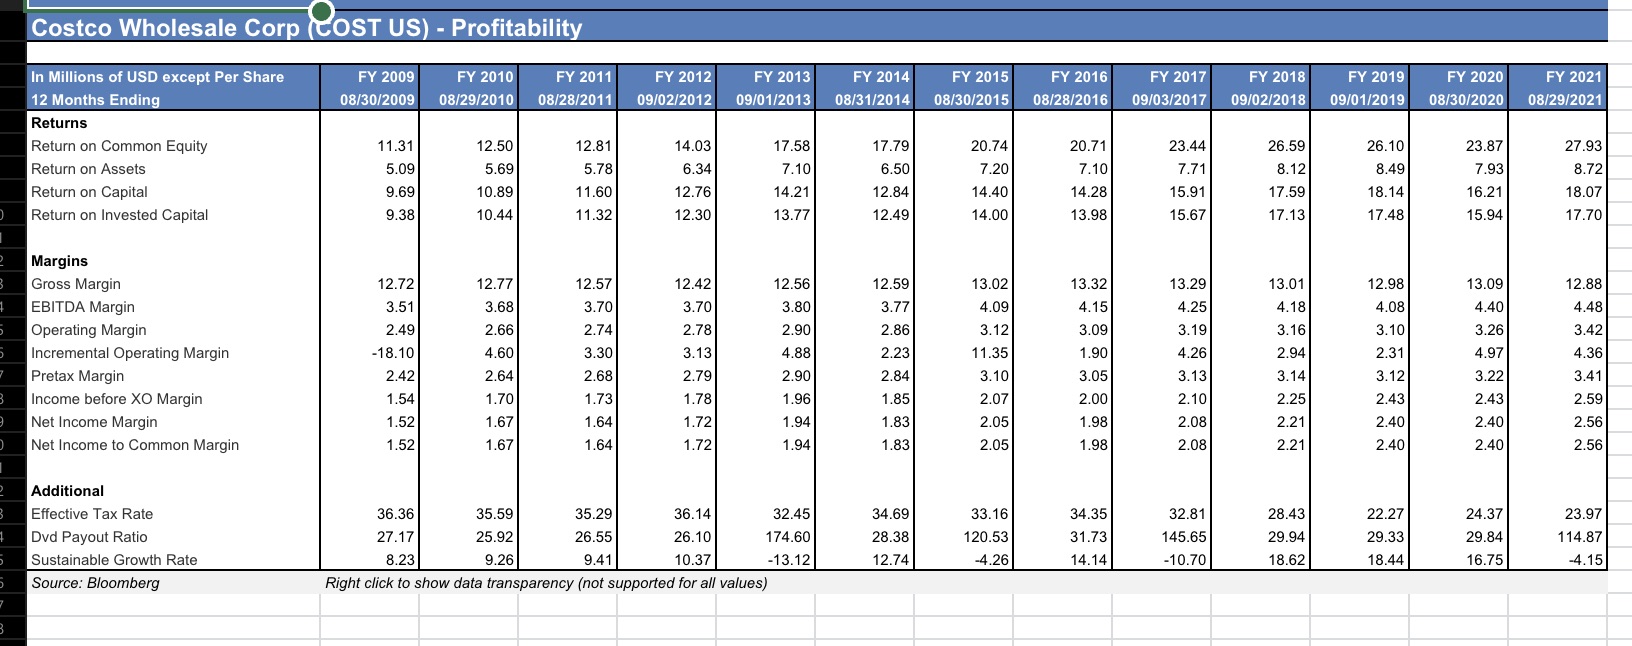
Costco Wholesale Corp (COST US) - BBG Adjusted In Millions of USD except Per Share FY 2012 FY 2013 FY 2014 Y 2015 FY 2016 FY 2018 FY 2019 FY 2020 FY 2021 Last 12M | FY 2022 Est | FY 2023 Est 12 Months Ending 9/02/2012 09/01/2013 130/2015 3/28/2016 09/02/2018 9/01/2019 08/30/2020 8/29/2021 05/08/2022 08/31/2022 08/31/2023 Revenue 99, 137.0 105,156.0 112,640.0 116,199.0 118,719.0 129,025.0 141,576.0 152,703.0 166,761.0 195,929.0 217,538.0 226,087.8 244,769.9 + Sales & Services Revenue 97,062.0 102,870.0 110,212.0 113,666.0 116,073.0 126,172.0 138,434.0 149,351.0 163,220.0 192,052.0 213,407.0 + Other Revenue 2,075.0 2,286.0 2,428.0 2,533.0 2,646.0 2,853.0 3,142.0 3,352.0 3,541.0 3,877.0 4,131.0 Cost of Revenue 6,823.0 91,948.0 98,458.0 101,065.0 102,901.0 111,882.0 123,152.0 132,886.0 144,939.0 170,684.0 190,537.0 + Cost of Goods & Services 86,823.0 91,948.0 98,458.0 101,065.0 102,901.0 111,882.0 123.152.0 32,886.0 144,939.0 170,684.0 190.537.0 Gross Profit 12,314.0 13,208.0 14, 182.0 15,134.0 15,818.0 17,143.0 18,424.0 19,817.0 21,822.0 25,245.0 27,001.0 24,010.5 26,552.6 + Other Operating Income 0.0 0. 0.0 0.0 0.0 0.0 0. 0.C 0. 0.0 0.0 Operating Expenses 9,515.0 10, 155. 10,962.0 11,598.5 2, 146.0 13,083.0 13,944.0 15, 118.0 16,347. 17,938. 19, 151.0 + Selling, General & Admin 9,501.0 0. 104.0 0,899.0 11,445.0 12,068.0 12,950.0 13,876.0 14,994.0 16,332.0 8,461.0 19,318.0 + Research & Development 0.0 0.C 0.0 0. 0.0 0.0 0.0 0.0 0.0 Other Operating Expense 14.0 63.0 153.5 78.0 133.0 68.0 124.0 -523.0 -167.0 Operating Income (Loss) 2,799.0 ,053. 1.220.0 3,535.5 ,672.0 4,060.0 4,480.0 ,699.0 5,474.3 7,307.0 7,850.0 7,883.7 8,781.6 Non-Operating (Income) Loss -8.0 2.0 23.0 20.0 53.0 72.0 38.0 28.0 68.0 28. 44.0 + Interest Expense, Net 16.0 55.0 61.0 74.0 92.0 84.0 38.0 -28.0 68.0 28. 28.0 + Interest Expense 95.0| 99.0 113.0 124.0 33.0 34.0 159.0 150.0 160.0 171.0 162.0 Interest Income 49.0 44 0 520 50.0 41.0 50 0 121.0 178.0 92.0 143.0 134.0 Foreign Exchangess 40.0 39.0 -26.0 47.0 28.0 0.0 0.0 0.0 0.0 -94.0 + (Income) Loss from Affiliates + Other Non-Op (Income) Loss -14.0 -12.0 -7.0 - 17.0 0.0 0.0 0.0 22.0 Pretax Income (Loss), Adjusted 2,807.0 3,051.0 3,197.0 3,515.5 3,619.0 3,988.0 4,442.0 4,727.0 5,406.3 ,279.0 7,894.0 7,898.7 8,818.2 Abnormal Losses (Gains) 40.0 0.0 0.0 -88 5 0.0 -51.0 0.0 -38 0 39.3 599.0 279.0 + Asset Write-Down -1.0 84.0 + Legal Settlement 24.0 51.0 + Other Abnormal Items 17.0 -88.5 -38.0 39.3 515.0 195.0 Pretax Income (Loss), GAAP 2,767.0 .051.0 3, 197.0 3,604.0 3,619.0 4,039.0 4,442.0 4,765.0 5,367.0 6,680.0 7,615.0 7,898.7 8,818.2 Income Tax Expense (Benefit) 1,000.0 990.0 1,109.0 1,195.0 1,243.0 1,325.0 1,263.0 1,061.0 1,308.0 1,601.0 1,884.0 + Current Income Tax 1.003.0 983.0 1.172. 1,296.0 974.0 352.0 1.313.0 911.0 1.218.0 1.540.0 + Deferred Income Tax -3.0 7.0 -63.0 -101.0 269.0 -27.0 -50.0 150.0 90.0 61.0 Income (Loss) from Cont Ops 1,767.0 2,061. ,088.0 2.409.0 2,376.0 2,714.0 3,179.0 ,704.0 ,059.0 5,079.0 5,731.0 5,834. 6,465.5 Net Extraordinary Losses (Gains) 0.0 0.0 0.0 0.0 0.0 0.0 0.0 0.0 0.0 0.0 0.0 + Discontinued Operations 0.0 0.0 0.0 0.0 0.0 0.0 0.0 0.0 0.0 0.0 + XO & Accounting Changes 0.0 0.0 00 0.0 00 0.C 00 0.0 00 0.0 Income (Loss) Incl. MI 1,767.0 2,061.0 2,088. 2,409.0 2,376. 2,714.0 3,179.0 3,704. ,059-0 ,079. 5,731.0 - Minority Interest 58.0 22.0 30.0 32.0 26.0 35.0 45.0 45.0 57.0 72.0 85.0 Net Income, GAAP 1,709.0 2,039. 2.058.0 2,377.0 ,350.0 2.679.0 3,134. ,659.0 1.002.0 5.007.0 5,646.0 5,834.1 6,465.5 - Preferred Dividends 0.0 0.0 00 0.0 00 0.0 0.0 0.0 00 0.0 - Other Adjustments 0.0 0. 0.0 0.C 0.0 0. 0.0 0.0 0.0 0.0 0.0 Net Income Avail to Common, GAAP 1,709.0 2,039. 2,058.0 2,377.0 2,350.0 2,679.0 3,134.0 3,659.0 4,002.0 5,007.0 5,646.0 5,834.1 6,465.5 Net Income Avail to Common, Adj 1,731.4 1,977.0 2,058.0 2,319.4 2,350.0 2.566.1 3,093.0 3,629.0 4,033.1 5,480.2 5,859.3 5,834. 6,469.0 Net Abnormal Losses (Gains) 22.4 -62.0 0.0 576 0.0 112.9 -41.0 -30.0 31.1 473.2 213.3 Net Extraordinary Losses (Gains) 0.0 0.0 0.0 0.0 0.0 0.0 0.0 O.C Basic Weighted Avg Shares 133.6 135.1 438.7 439.5 438.6 138.4 138.5 439.8 142.3 443.1 443. Basic EPS, GAAP 3.94 4.68 4.69 5.41 5.36 6.11 7.15 8.32 9.05 11.30 12.74 13.11 14.48 Basic EPS from Cont Ops, GAAP 3.94 4.68 4.69 5.41 5.36 6.11 7.15 8.32 9.05 11.30 12.74 13.11 14.48 Basic EPS from Cont Ops, Adjusted 3.99 154 4.69 5.28 5.36 5.85 7.05 8.25 .12 12.37 13.21 13.11 14.49 Diluted Weighted Avg Shares 439.4 440.5 442.5 442.7 141.3 440.9 141.8 442.9 143.9 444.3 444.9 Diluted EPS, GAAP 3.89 4.63 4.65 5.37 5.33 6.08 7.09 8.26 9.02 11.27 12.70 13.11 14.48 Diluted EPS from Cont Ops, GAAP 3.89 4.63 4.65 5.37 5.33 6.08 7.09 8.26 9.02 11.27 12.70 13.11 14.48 Diluted EPS from Cont Ops, Adjusted 3.94 4.49 4.65 5.24 5.33 5.82 7.00 8.19 9.09 12.34 13.18 13.11 14.49 Reference Items Accounting Standard US GAAP US GAAP US GAAP US GAAP US GAAP US GAAP US GAAP US GAAP US GAAP US GAAP EBITDA 3,707.0 3.999.0 4,249.0 4,662.5 1,927.0 5.430.0 5,917.0 6, 191.0 7,371.3 3.384.0 ,715.0 9,826.4 10,926.1 EBITDA Margin (T12M) 3.74 3.80 3.7 4.01 4.15 4.21 4.18 4.05 4.42 4.79 4.47 4.35 4.46 EBIT 2,799.0 3,053.0 3,220.0 3,535.5 3,672.0 4,060.0 4,480.0 4,699.0 5,474.3 7,307.0 7,850.0 7,883.7 8,781.6 Gross Margin 12.42 12.56 12.59 13.02 13.32 13.29 13.01 12.98 13.09 12.88 12.41 0.62 10.85 Operating Margin 2.82 2.90 2.86 3.041 3.09 3.151 3.16 3.08 3.28 3.73 3.61| 3.49 3.59 Profit Margin 1.75 1.88 1.83 2.00 1.99 2.18 2.38 2.42 2.80 2.69 2.58 2.64 Sales per Employee 569,752.87 1,020,932.04 1,005,714.29 566,824.39 942,214.29 970,112.78 990,041.96 1,024,852.35 1,068,980.77 680,309.03 Dividends per Share 1.03 8.17 1.33 6.51 1.70 8.90 2.14 2.44 2.70 12.98 3.27 3.33 3.68 Total Cash Common Dividends 46.0 3,560.0 84.0 2,865.0 45.6 3,902.1 38.4 1,073.0 1, 194.2 5,751.3 1.449.1 Capitalized Interest Expense 10.0 12.0 11.0 14.0 19.0 16.0 0.0 0.0 0.0 Rental Expense 220.0 225.0 230.0 252.0 250.0 258.0 265.0 268.0 339.0 447.0 Source: Bloomberg Right click to show data transparency (not supported for all values)Costco Wholesale Corp (COST US) - Profitability In Millions of USD except Per Share FY 2009 FY 2010 FY 2011 FY 2012 FY 2013 FY 2014 FY 2015 FY 2016 FY 2017 FY 2018 FY 2019 FY 2020 FY 2021 12 Months Ending 08/30/2009 08/29/2010 08/28/2011 09/02/2012 09/01/2013 08/31/2014 08/30/2015 08/28/2016 09/03/2017 09/02/2018 09/01/2019 08/30/2020 08/29/2021 Returns Return on Common Equity 11.31 12.50 12.81 14.03 17.58 17.79 20.74 20.71 23.44 26.59 26.10 23.87 27.93 Return on Assets 5.09 5.69 5.78 3.34 7.10 6.50 7.20 7.10 7.71 8.12 8.49 7.93 8.72 Return on Capital 9.69 10.89 11.60 12.76 14.21 12.84 14.40 14.28 15.91 17.59 18.14 16.21 18.07 Return on Invested Capital 9.38 10.44 11.32 12.30 13.77 12.49 14.00 13.98 15.67 17.13 17.48 15.94 17.70 Margins Gross Margin 12.72 12.77 12.57 12.42 12.56 12.59 13.02 13.32 13.29 13.01 12.98 13.09 12.88 EBITDA Margin 3.51 3.68 3.70 3.70 3.80 3.77 4.09 4.15 4.25 4.18 4.08 4.40 4.48 Operating Margin 2.49 2.66 2.74 2.78 2.90 2.86 3.12 3.09 3.19 3.16 3.10 3.26 3.42 Incremental Operating Margin -18.10 4.60 3.30 3.13 4.88 2.23 11.35 1.90 4.26 2.94 2.31 4.97 4.36 Pretax Margin 2.42 2.64 2.68 2.79 2.90 2.84 3.10 3.05 3.13 3.14 3.12 3.22 3.41 Income before XO Margin 1.54 1.70 1.73 1.7 1.96 1.85 2.07 2.00 2.10 2.25 2.43 2.43 2.59 Net Income Margin 1.52 1.67 1.64 1.72 1.94 1.83 2.05 1.98 2.08 2.21 2.40 2.40 2.56 Net Income to Common Margin 1.52 1.67 1.64 1.72 1.94 1.83 2.05 1.98 2.08 2.21 2.40 2.40 2.56 Additional Effective Tax Rate 36.36 35.59 35.29 36.14 32.45 34.69 33.16 34.35 32.81 28.43 22.27 24.37 23.97 Dvd Payout Ratio 27.17 25.92 26.55 26.10 174.60 28.38 120.53 31.73 145.65 29.94 29.33 29.84 114.87 Sustainable Growth Rate 8.23 9.26 9.4 10.37 -13.12 12.74 -4.26 14.14 -10.70 18.62 18.44 16.75 -4.15 Source: Bloomberg Right click to show data transparency (not supported for all values)