

Question: HOW TO DO THIS PLEASE? Required Information The following information appwes to the questions displayed below.] Selected comparative financial statements of Korbin Company follow KORBIN
![the questions displayed below.] Selected comparative financial statements of Korbin Company follow](https://dsd5zvtm8ll6.cloudfront.net/si.experts.images/questions/2024/09/66e92a9abb16c_82566e92a99e29ba.jpg) HOW TO DO THIS PLEASE?
HOW TO DO THIS PLEASE?
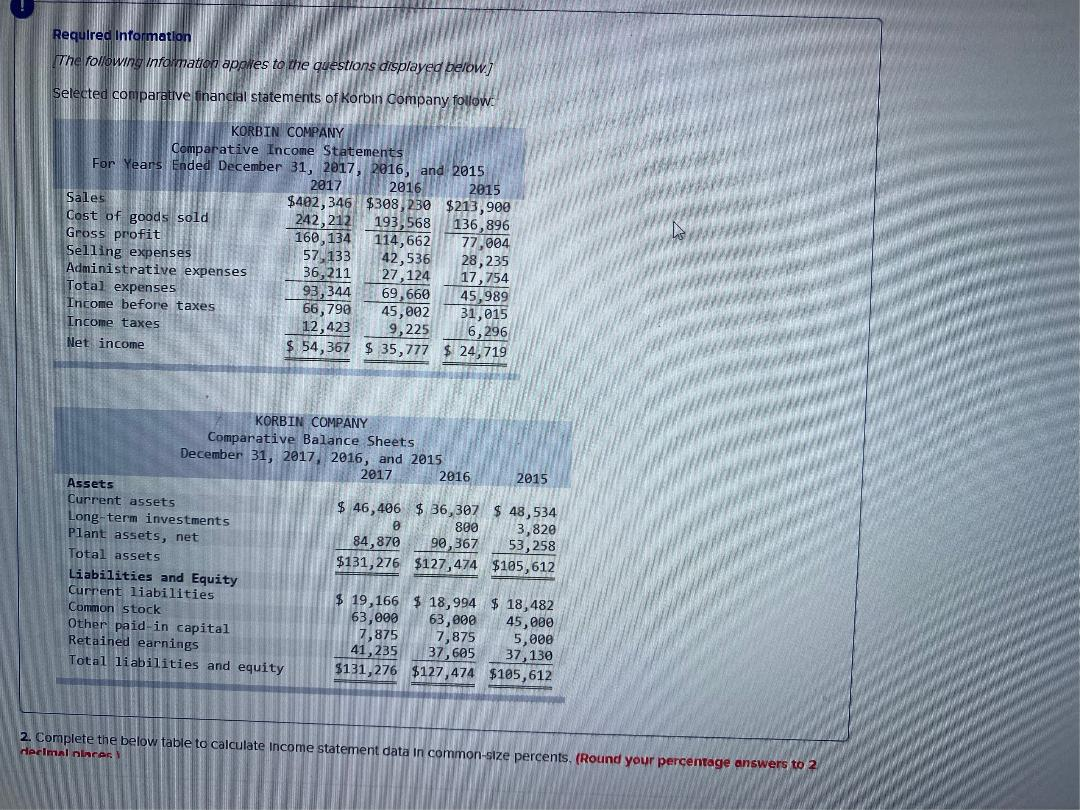
Required Information The following information appwes to the questions displayed below.] Selected comparative financial statements of Korbin Company follow KORBIN COMPANY Comparative Income Statements For Years Ended December 31, 2017, 2016, and 2015 2017 2016 2015 Sales $402,346 $308,230 $213,900 Cost of goods sold 242,212 193,568 136,896 Gross profit 160,134 114,662 77,004 Selling expenses 57. 133 42,536 28, 235 Administrative expenses 36,211 27,124 17,754 Total expenses 93,344 69,660 45,989 Income before taxes 66,790 45,002 31,015 Income taxes 12,423 9,225 6,296 Net income $ 54,367 $ 35,777 $ 24,719 KORBIN COMPANY Comparative Balance Sheets December 31, 2017, 2016, and 2015 2017 2016 2015 Assets Current assets $ 46,406 $ 36,307 $ 48,534 Long-term investments 800 3,820 plant assets, net 84,870 90,367 53, 258 Total assets $131,276 $127,474 $105,612 Liabilities and Equity Current liabilities $ 19,166 $ 18,994 $ 18,482 Common stock 63,000 63,000 45,000 Other paid in capital 7,875 7,875 5,000 Retained earnings 41,235 37,605 37, 130 Total liabilities and equity $131,276 $127,474 $185,612 2. Complete the below table to calculate Income statement data in common-size percents, (Round your percentage answers to 2 decimal ninces 2016 2015 KORBIN COMPANY Comparative Balance Sheets December 31, 2017, 2016, and 2015 2017 Assets Current assets $ 46,406 36,307$ 48,534 Long-term investments 809 3,820 Plant assets, net 84,870 90,367 53,258 Total assetis $131,276 $127,474 $105,612 Liabilities and Equity Current liabilities $ 19,166 $ 18,994 $ 18,482 Common stock 63,000 63,000 45,000 Other paid-in capital 7,875 7,875 5,000 Retained earnings 41, 235 37,130 Total liabilities and equity $131,276 $127,474 $105,612 37,605 2. Complete the below table to calculate income statement data in common-size percents. (Round your percentage answers to 2 decimal places.) 2015 KORBIN COMPANY Common-Size Comparative Income Statements For Years Ended December 31, 2017, 2016, and 2015 2017 2016 Sales Cost of goods sold Gross profit Selling expenses Administrative expenses Total expenses Income before taxes Income taxes Net income % %
Step by Step Solution
There are 3 Steps involved in it

Get step-by-step solutions from verified subject matter experts