

Question: How to do this two tables in Excel? Utility cost R 0.9829 290000 270000 3000 2500 250000 PAGE 425 machine QUARTER hours UTILITY COSTS 1
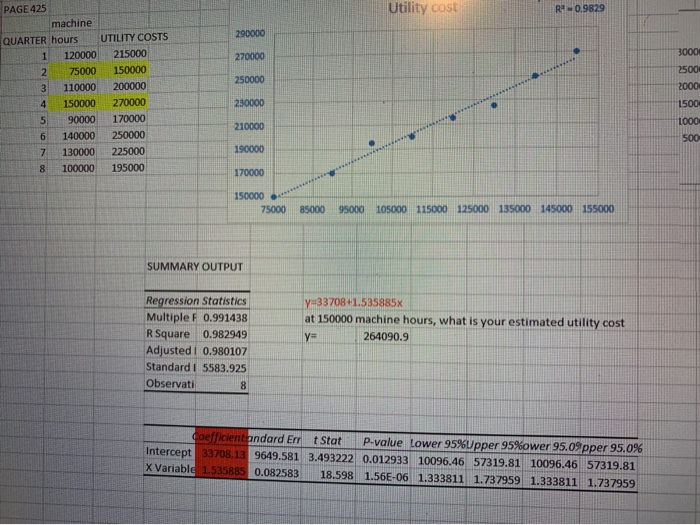
Utility cost R 0.9829 290000 270000 3000 2500 250000 PAGE 425 machine QUARTER hours UTILITY COSTS 1 120000 215000 2 75000 150000 3 110000 200000 4 150000 270000 90000 170000 6 140000 250000 7 130000 225000 8 100000195000 2000 230000 1500 210000 190000 170000 150000 75000 95000 95000 105000 115000 125000 135000 145000 155000 SUMMARY OUTPUT Regression Statistics Multiple F 0.991438 R Square 0.982949 Adjustedi 0.980107 Standard I 5583.925 Observati y 33708+1.535885% at 150000 machine hours, what is your estimated utility cost 264090.9 y= coefficientandard Err Stat P-value Lower 95%Upper 95%ower 95.0%pper 95.0% Intercept 33708,13 9649.581 3.493222 0.012933 10096.46 57319.81 10096.46 57319.81 X Variable 1.535885 0.082583 18.598 1.56E-06 1.333811 1.737959 1.333811 1.737959
Step by Step Solution
There are 3 Steps involved in it

Get step-by-step solutions from verified subject matter experts